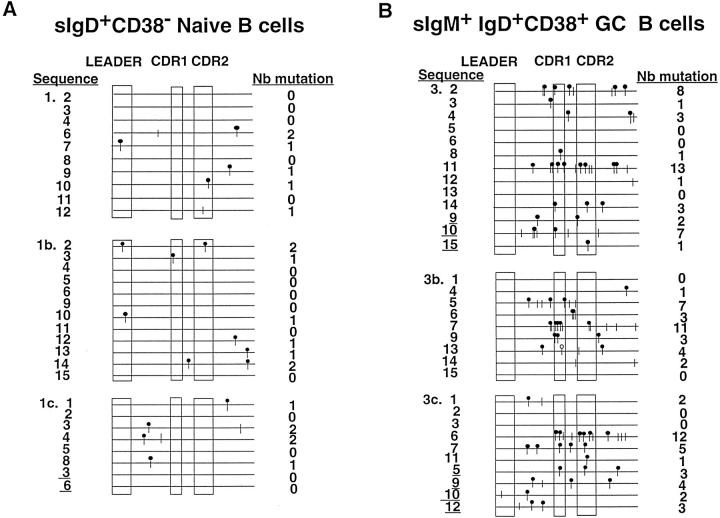
Figure 3.
Schematic representation of mutations in rearranged VH5-μ sequences. Each line represents one VH5 sequence. VH5-2 sequences are underlined. Leader region, CDR1, and CDR2 are indicated. Mutations present in the DJH regions are not shown. Mutations are represented by different symbols. •, replacement mutation; ‖, silent mutation; ○, stop codon. (A and B) VH5-μ sequences from slgM+IgD+CD38− B cells and sIgM+IgD+CD38+ B cells, respectively. The upper, middle, and lower groups of sequences represent three different tonsil samples. (C and D) VH5-μ sequences from medium-sized and large sIgM+IgD+CD38+ B cells, respectively, that were isolated from the fourth tonsil.


