Figure 2.
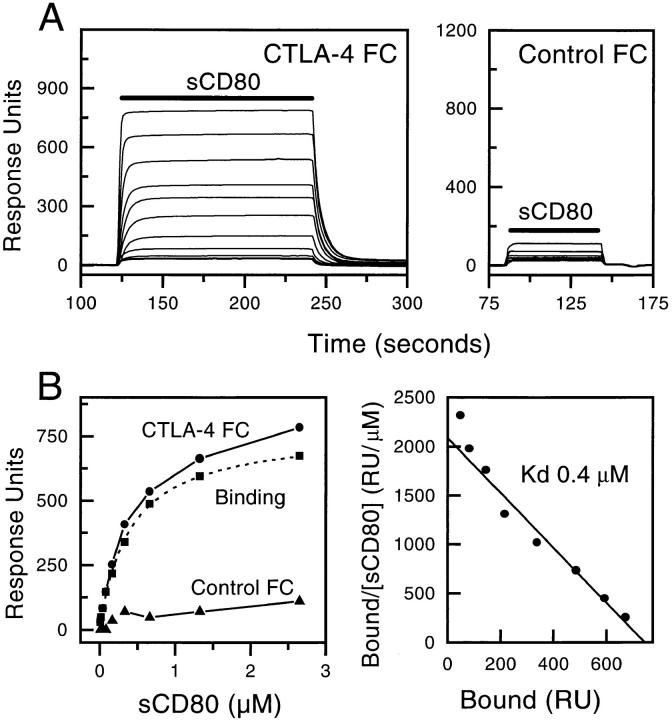
Measuring the affinity of sCD80 binding to CTLA-4 Ig by equilibrium binding. (A) A range of sCD80 concentrations (2.65 μM and nine twofold dilutions thereof) were injected sequentially (solid bar) for 2 min at 10 μl/min through a flow cell (FC) with either CTLA-4 Ig (1,500 RUs) or no protein (Control) immobilized. sCD80 (0.26 μM) bound to a very similar level (255 and 250 RUs) when injected at the beginning and end of the experiment (data not shown), indicating that the immobilized CTLA-4 Ig was stable. (B) The equilibrium responses in the CTLA-4 Ig (•) and Control (▴) FCs at each sCD80 concentration and the differences between these responses (representing actual binding, ▪) are plotted. The dotted line represents a nonlinear fit of the Langmuir binding isotherm to the binding data and yields a K d of 0.4 μM and a binding maximum of 774 RUs. A Scatchard plot of the same data is shown on the right. A linear regression fit yields a K d of 0.4 μM and a binding maximum of 750 RUs.

