Figure 5.
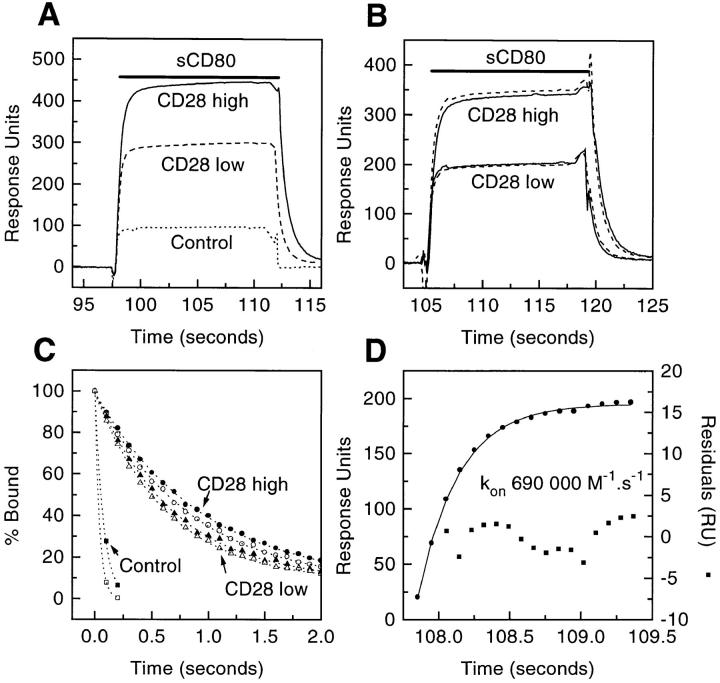
Estimating the k on and k off for sCD80 binding CD28 Ig. (A) Example of primary data. sCD80 (2.65 μM) was injected (solid bar) at 80 μl/min through FCs with nothing immobilized (Control) or CD28 Ig immobilized at low (3400 RUs) or high (6200 RUs) levels. (B) Effect of varying the flow rate. sCD80 (2.65 μM) was injected (solid bar) at 40 (solid line) or 80 (stippled line) μl/min through FCs with high or low levels of CD28 Ig. Background responses (following injection through a control FC) have been subtracted. (C) Dissociation of sCD80 from FC with high (•, ○) or low (▴, ▵) levels of CD28 Ig at flow rate of 40 (•, ▴, ▪) or 80 (○, ▵, □) μl/min. Also shown is the fall in response in the same period following injection of sCD80 through a control FC (▪, □). The data fitted well to single exponential decay curves (dotted lines), yielding the following t1/2 values: •, 0.93 s; ○, 0.84 s; ▴, 0.69 s; Δ, 0.64 s; ▪, 0.075 s; □, 0.04 s. (D) Obtaining the k on by nonlinear curve fitting. Eq. 1 (see Materials and Methods) was fitted (solid line) to data (•) from (B) (corresponding to binding of sCD80 to CD28 Ig [low level] at 80 μl/min), yielding the indicated residuals (▪) and k on.

