Figure 1.
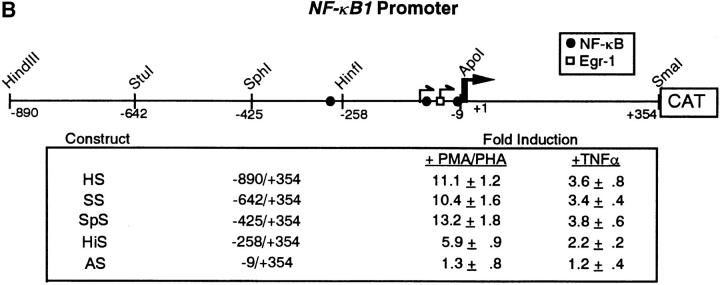
NF-κB1 gene expression and promoter analysis in CEM cells after PMA/ PHA or TNF-α stimulation. (A) RNAs were isolated from CEM cells after addition of either PMA/PHA (50 ng and 5 μg/ml) or TNF-α (10 ng/ml) over the time course indicated. RNAs were detected using a 32Plabeled NF-κB1-specific probe. Transcripts encoding NF-κB1 were quantitated by densitometric scanning of autoradiograms and the fold accumulation of mRNAs were calculated after normalization to β-actin. (B) Schematic of the NF-κB1 promoter depicting the Egr-1 and NF-κB binding sites. CEM cells were transfected with either the HS-CAT reporter or with various deletion constructs (SS-, SpS-, HiS-, and AS-CAT). 18 h after transfection, cells were stimulated with either PMA/PHA (50 ng and 5 μg/ ml) or TNF-α (10 ng/ml) and CAT activity was analyzed. Transfection experiments were performed in triplicate and the mean fold induction and the standard deviations are shown.


