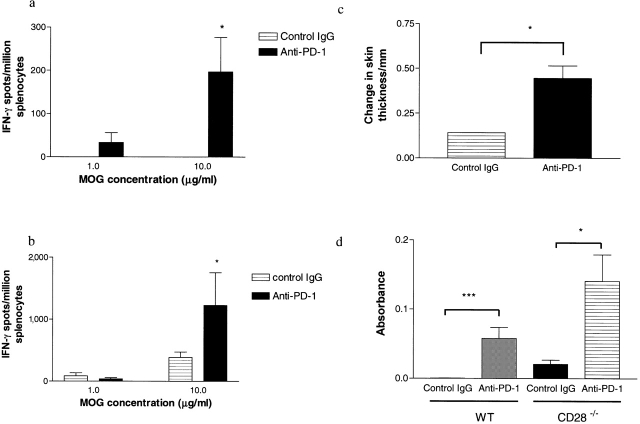
Figure 3.
T cell and antibody responses to MOG in animals treated with PD-1 blockade. ELISPOT analysis from one representative experiment, demonstrating the frequency of MOG-specific IFN-γ–producing T cells at different concentrations of antigen for WT (a) and CD28-deficient animals (b). In the WT group, anti–PD-1–treated animals (solid bars) had a higher frequency of MOG-specific IFN-γ–producing T cells at all antigen concentrations compared with controls (hatched bars, *, P = 0.017 by one-way ANOVA). In the CD28-deficient mice, a significant difference was also seen at higher antigen concentrations (*, P = 0.0254 by one-way ANOVA). (c) DTH measurement assessed by an increase in footpad skin thickness after intradermal injection with 50 μg antigen. DTH response was significantly greater in the anti–PD-1–treated animals than controls (*, P = 0.0245 by two-tailed Mann-Whitney U test). (d) Serum level of anti-MOG antibodies obtained on day 14 after immunization were greater in anti–PD-1–treated animals than controls in both WT and CD28-deficient animals (*, P = 0.0476; **, P = 0.0009 by two-tailed Mann-Whitney U test).

