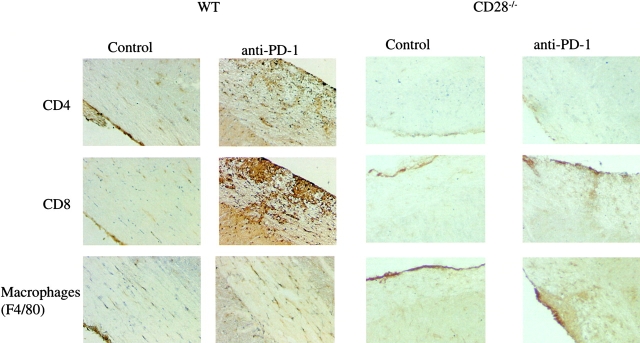
Figure 4.
Immunohistology of the CNS in animals treated with PD-1 blockade. Spinal cord sections from WT and CD28-deficient animals treated with anti–PD-1 or control antibody were obtained on day 14 after immunization and stained with anti-CD4, anti-CD8, and anti-F4/80. There is a visible increase in the number of CD4+ and CD8+ T cells as well as the macrophages (F4/80+ cells) in the anti–PD-1–treated mice, compared with controls in both the WT and CD28-deficient animals, more apparent in the former (×200).

