
Figure 1.

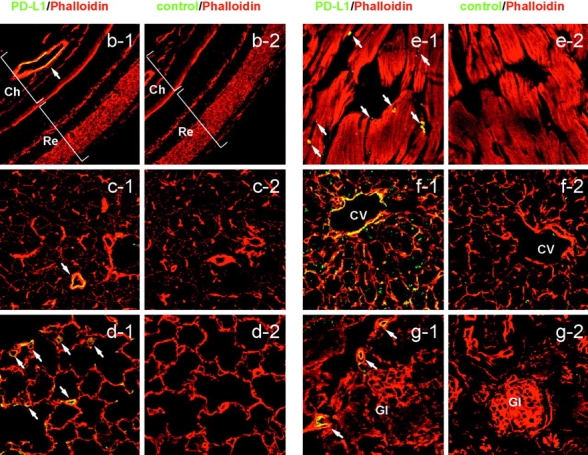
PD-L1 expression on vascular endothelium. (a) ECs were freshly isolated from murine heart and stained with anti-PD-L1 or anti-PD-L2 (open curves). The filled curves represent control IgG. (b-g) Biotinylated F(ab′)2 of anti-PD-L1 (b-g1) or control IgG (b-g2) was intravenously injected into mice and organs were harvested 1 h later. Sections were stained with streptavidin-FITC (green) and counterstained with phalloidin (red). (b) Eye, (c) submandibular gland, (d) lung, (e) heart, (f) liver, (g) kidney. Ch, choroid; CV, central vein; Gl, glomerulus; Re, retina. The arrows represent vascular endothelial cells. Original magnification, ×40.