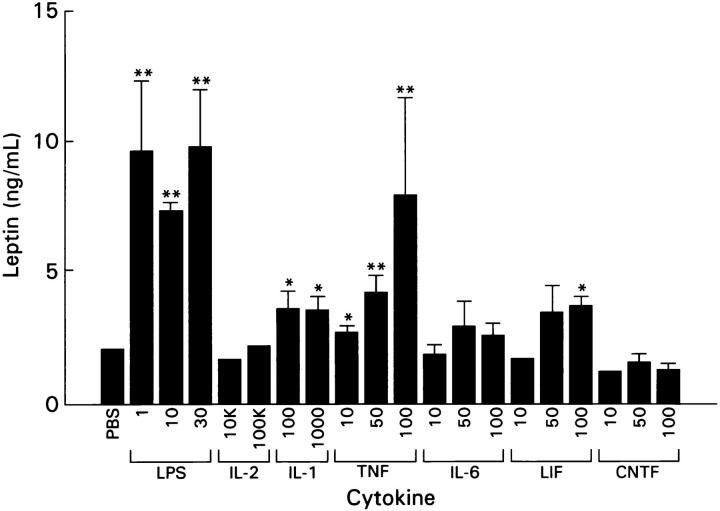
Figure 2.
Leptin levels after i.p. administration of various cytokines and LPS. Mice were injected with LPS (mg/kg) or recombinant cytokine in the doses shown (IL-2, IL-1: U/mouse; TNF, IL-6, LIF, CNTF: μg/kg) or PBS after a 7-h fast and sera and adipose tissue harvested 5 h later. Further details are in Materials and Methods. Each bar represents the mean ± SEM serum leptin level of 6–7 mice. Significance compared with the PBS-treated animals is indicated as *P <0.05, **P <0.01.

