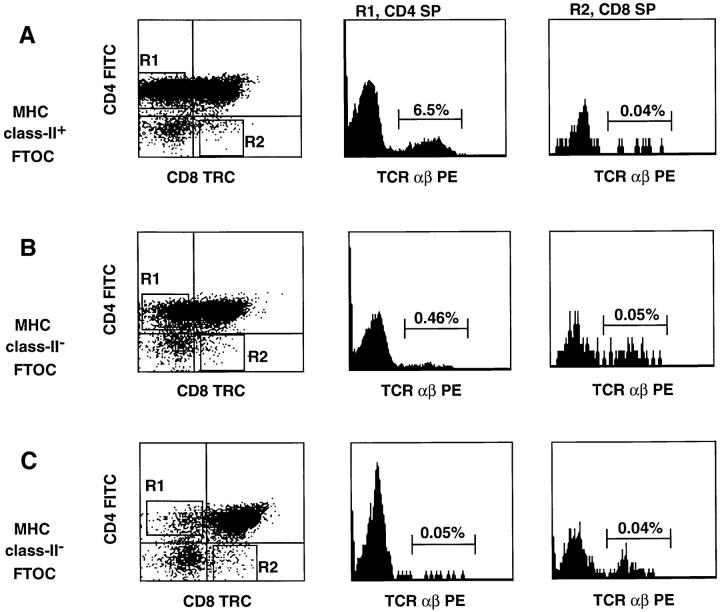
Figure 3.
Multiparameter analysis of cells harvested from one FTOC with thymi of MHC class II–positive mice (A and D) and two FTOC with MHC class II–deficient mice (B and C). FTOC were set up as indicated in Materials and Methods with 25,000 CD34+CD1a− postnatal thymocytes per lobe and incubated for 4 wk. Cell numbers harvested from the FTOC cultures were 150,000 cells per lobe in the culture with MHC class II–positive thymic lobes (A and D), and 175,000 (B) and 100,000 cells (C) per lobe in the cultures with MHC class II–negative thymic lobes. Cells harvested from the FTOC cultures were stained for threecolor analysis with CD4 FITC, TCR αβ PE, and CD8 TRC. Human cells were gated on the basis of forward and side scatter profile; all cells within this gate were positive for human CD45. CD4 against CD8 staining is indicated as dot plots. The histograms show the expression of TCR αβ on the CD4+CD8− and CD8+CD4− thymocytes. Numbers in histograms represent the percentages of CD4+ or CD8+ TCR αβ+ SP cells in the total population of human cells derived from the FTOC.


