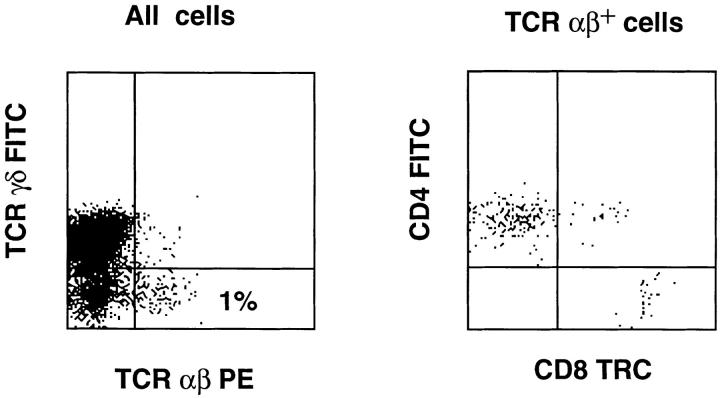
Figure 5.
Phenotype of T cells expanded from the FTOC (the same one as indicated in Fig. 4) with a feeder cell mixture, PHA, and IL-2. Expanded cells were stained with TRC γδ FITC and TCR αβ PE or with CD4 FITC, TCR αβ PE, and CD8 TRC. The dot plots show the expression of TCR γδ versus TCR αβ of all cells and the expression of CD4 against CD8 of gated TCR αβ+ cells.

