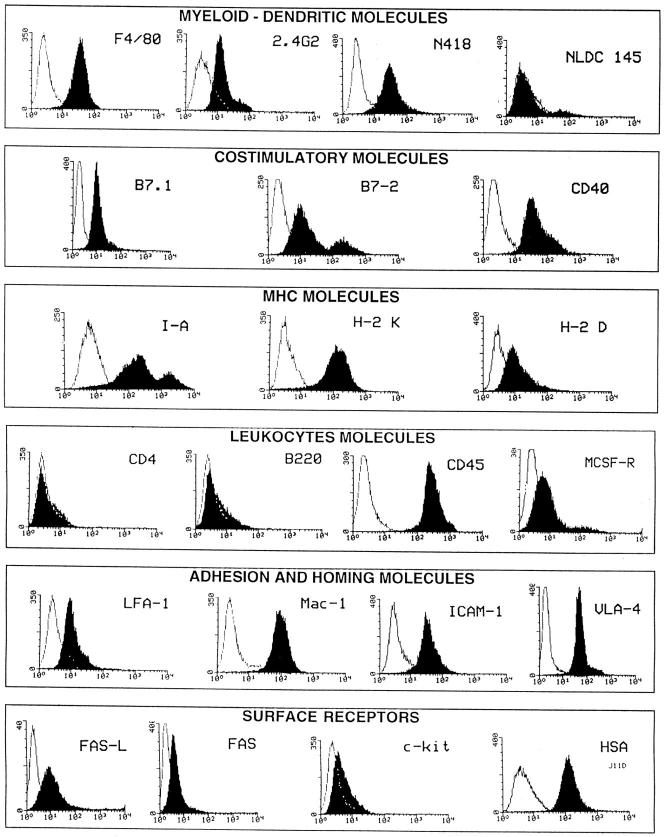
Figure 2.
Surface markers of D1 bulk culture by FACS® analysis. Filled histograms are showing binding of specific antibodies, whereas isotype matched control antibodies or secondary reagents are represented by open histograms. Cell surface phenotype was assessed with antibodies as indicated in Materials and Methods. Before all labeling experiments, FcR blocking was performed by incubating cells with 5% normal mouse serum or anti FcR (2.4G2) mAb.

