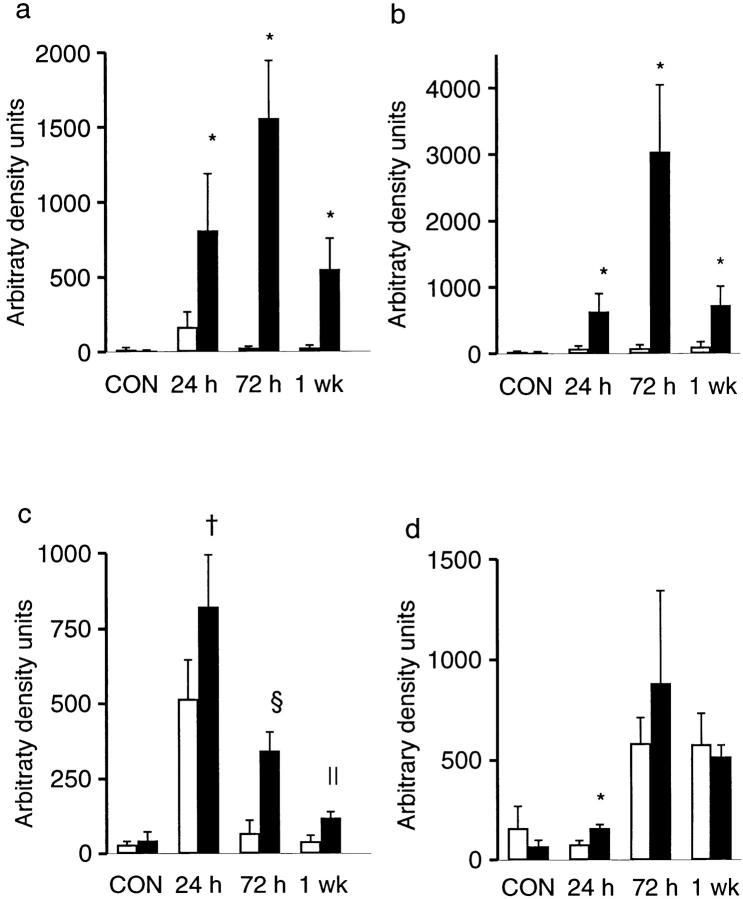
Figure 7.
Densitometric analysis of cytokine expression in wild-type and X-CGD mice receiving A. fumigatus hyphae. Autoradiographs were scanned and optical density calculated after background subtraction. Optical density was expressed as arbitrary density units and then normalized to β-actin expression. Data expressed as mean ± SD. (a) IL1β; (b) TNF-α; (c) KC; (d) TGFβ1. Open bars, wild-type mice; filled bars, X-CGD mice. *, significantly different from wild type (P <0.05, Mann-Whitney U test); ‡, significantly different from wild type (P <0.05, t test); §, significantly different from wild type (P <0.0005, t test); ∥, significantly different from wild type (P <0.005, t test).

