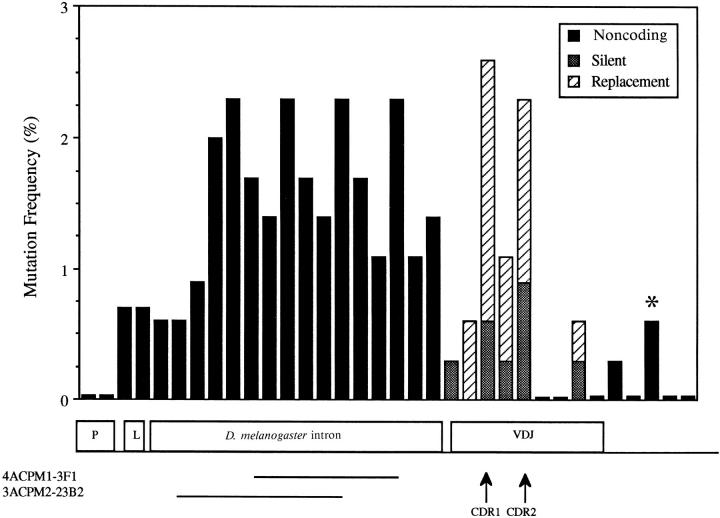
Figure 4.
Mutation frequency distribution in the enlarged leader intron hybrid loci. Seven hybridomas from three different mice (two of the CPM1 line and one of the CPM2 line) representing the entire range of VH mutation observed (see Fig. 2 and Table 2) were analyzed. The mutation frequency was determined as follows: number of mutations in a 50-bp interval divided by 350 (the total number of bases in the interval sequenced from all the hybridomas) × 100. The first 50-bp interval began 8 bp 5′ of the purine rich motif in the VH promoter. The solid lines under the D. melanogaster intron indicate those intervals that were deleted from the hybrid loci in hybridomas 4ACPM1-3F1 and 3ACPM2-23B2. A total of 350 bp were deleted from the 4ACPM1-3F1 hybrid locus; in addition, this hybridoma also had the most mutations in its V(D)J coding sequence, 12, of any enlarged leader intron hybridoma analyzed. *, 3′ flanking interval in which two mutations were observed in the 4ACPM1-3F1 hybrid locus. A total of 470 bp were deleted from the 3ACPM2-23B2 hybrid locus. These large deletions were scored as one mutation per interval deleted. The mutation frequency in the VDJ was calculated using either those mutations that do not encode amino acid substitutions (silent mutations − stippled bars) or those mutations that encode amino acid changes (replacement mutations − diagonal striped bars).

