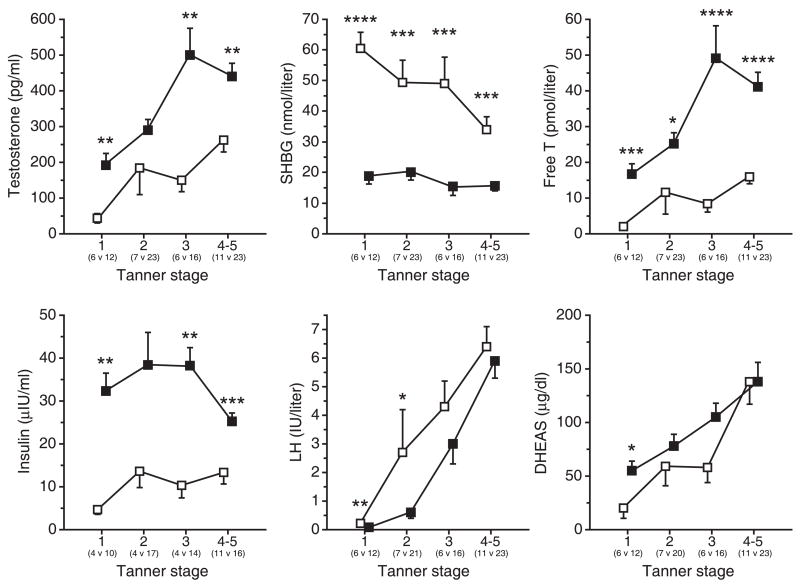
Figure 1. Graphical representation of observed differences between obese and normal weight girls grouped by Tanner stage.
Data are presented as mean ± SEM. Differences are assessed with Wilcoxon rank sum tests and are also denoted in Table 1. * P < 0.05, ** P ≤ 0.01, *** P ≤ 0.001, **** P ≤ 0.0001 prior to Bonferroni correction. Conversion from conventional to SI units: total T × 3.47 (nmol/liter); insulin × 7.18 (pmol/liter); DHEAS × 27.21 (nmol/liter).

