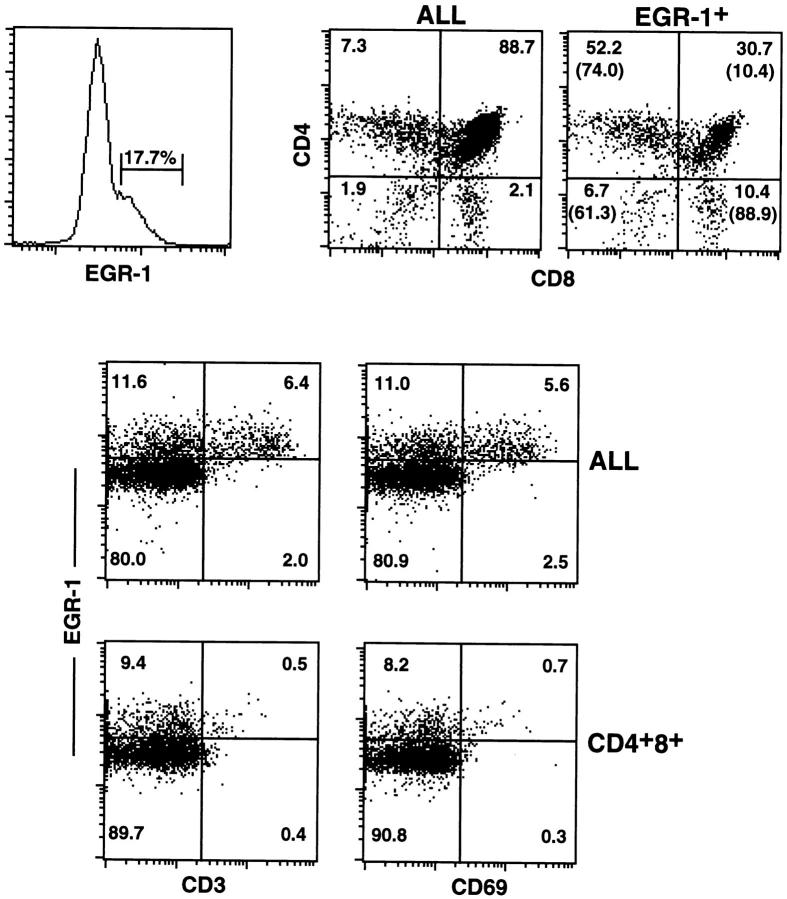
Figure 9.
Expression of Egr-1 protein in thymocyte subsets. Thymocytes from a young adult mouse were 4-color stained for expression of CD4, CD8, Egr-1, and CD69 or CD3, and analyzed by FACS® as described in Materials and Methods. Indicated in the dot plots are the percentage of thymocytes within each quadrant, or in parenthesis (upper right dot plot), the percentage of Egr-1+ thymocytes within each thymocyte subset. Where indicated, staining is shown for gated populations of thymocytes (either Egr-1+thymocytes as shown in histogram, or CD4+8+ thymocytes). Similar results were obtained from three other individual animals.

