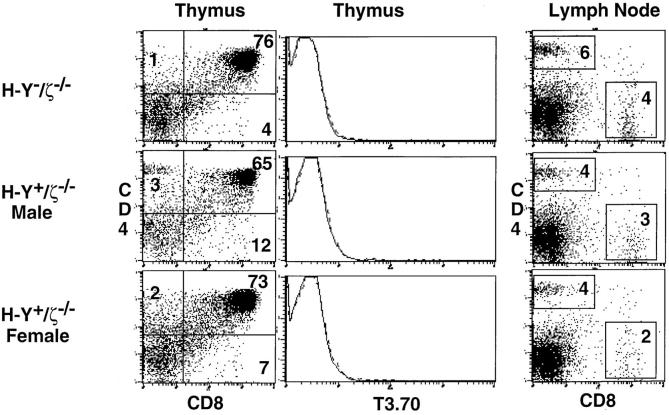
Figure 2.
Phenotype of H-Y−/ζ−/− and H-Y+/ζ−/− mice. Data show immunofluorescence and multicolor FCM analysis of thymocytes and LN T cells from adult (6–12-wk-old) H-2Db mice. Three-color FCM analysis was performed on cells stained with anti–H-Y clonotypic antibody (T3.70) conjugated to FITC, anti-CD8–PE and anti-CD4–biotin, followed by streptavidin–red 670 (16). CD4 versus CD8 two-color profiles are displayed on total thymocytes or total lymph node T cells. Single-color profiles (solid lines) depict T3.70 staining on total thymocytes. Dotted lines reflect staining with negative control antibody.

