
Figure 3.

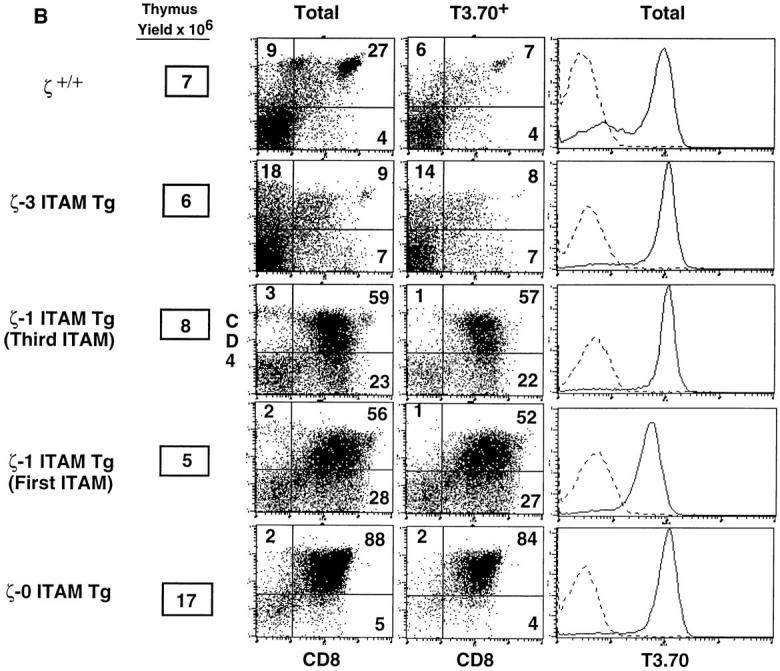
Role of TCRζ–mediated signals in thymocyte positive and negative selection. (A) Phenotype of thymocytes from H-Y+/ζ−/−; ζ Tg female mice. (B) Phenotype of thymocytes from H-Y+/ζ−/−; ζ Tg male mice. H-Y+/ζ−/− mice were reconstituted with transgenes encoding either full-length ζ chains (ζ-3 ITAM Tg), ζ chains that contain a single ITAM (either the first or third, ζ-1 ITAM Tg) or ζ chains that lack ITAMs (ζ-0 ITAM Tg). Data show immunofluorescence and multicolor FCM analysis of thymocytes from adult H-2Db mice. Three-color FCM was performed on cells stained with anti–H-Y clonotypic antibody (T3.70) conjugated to FITC, anti-CD8–PE, and anti-CD4– biotin, followed by streptavidin– red 670 (16). Two-color plots show total thymocytes or software-gated T3.70+ thymocytes. Numbers in the quadrants reflect the percentage of total thymocytes in that quadrant. Singlecolor profiles (solid lines) depict T3.70 staining on either CD4+CD8+ thymocytes (A) or total thymocytes (B). Dotted lines reflect staining with negative control antibody.