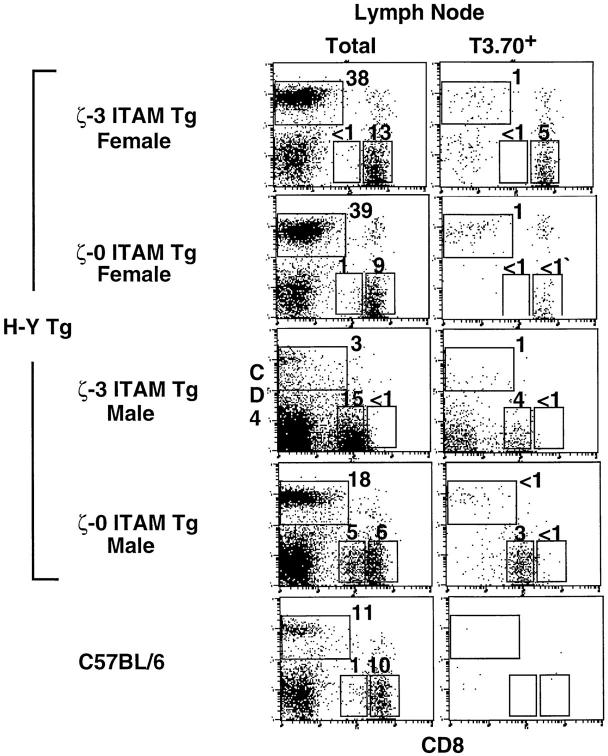
Figure 4.
Analysis of LN T cells from H-Y+/ζ Tg mice. Immunofluorescence and multicolor FCM analysis of LN cells from adult female and male H-Y+/ ζ-3 ITAM Tg or H-Y+/ζ-0 ITAM Tg mice. Also shown are LN cells from a nontransgenic C57BL/6 (H-Y−/ζ+/+) mouse. Threecolor FCM was performed on total LN cells after staining with FITC– anti–H-Y clonotypic antibody (T3.70), anti-CD8–PE and anti-CD4– biotin, followed by streptavidin–red 670. CD4 versus CD8 two-color profiles are displayed on total (left) or gated T3.70+ (right) cells. Numbers in the regions reflect the percentage of total cells found in that region.

