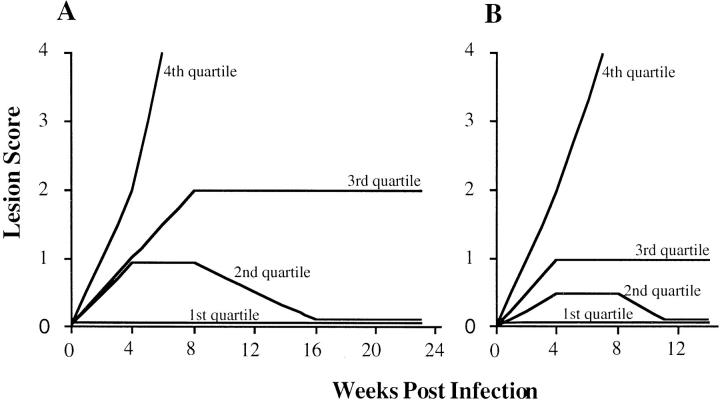
Figure 2.
The kinetics of lesion development after L. major infection in the F2 generation expressed as the lesion score over time. A and B represent two separate experiments with 199 and 271 F2 mice, respectively. The first quartile represents the lesion score of the animal at the 25th percentile, the second quartile represents the 50th percentile animal, etc. These data demonstrate a continuous distribution of this trait in the F2 generation. Animals were slightly more resistant in the second experiment compared to the first.

