Figure 3.
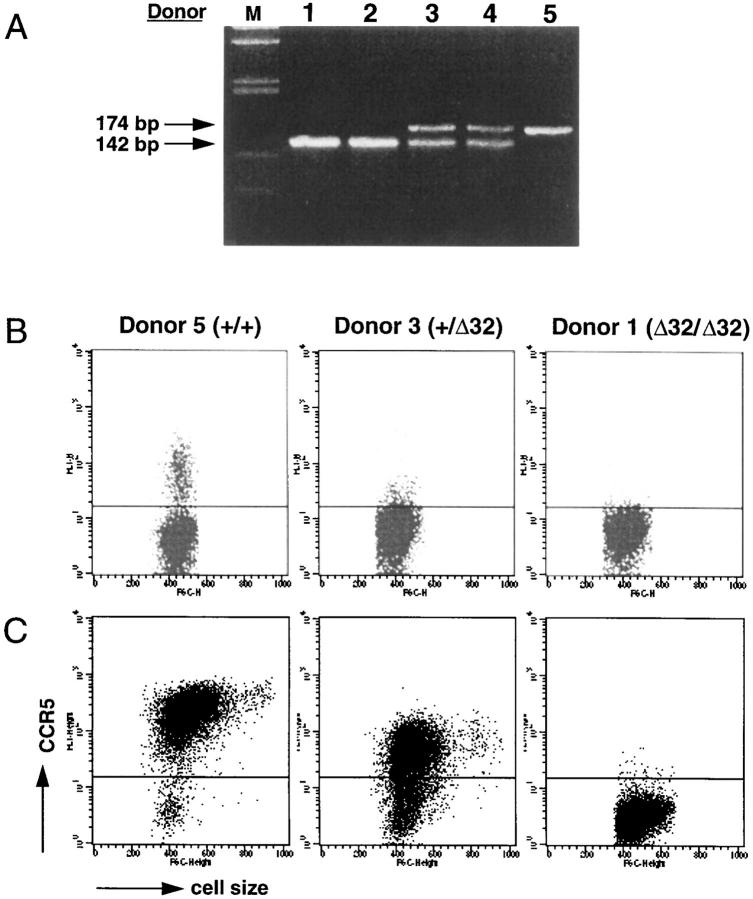
Expression of CCR5 on T cells from normal (+/+), heterozygous (+/Δ32), and Δ32 homozygous (Δ32/Δ32) individuals. (A) Identification of +/+, +/Δ32, and Δ32/Δ32 individuals by PCR. Genomic DNA was isolated from PBMC of selected blood donors. PCR reactions were carried out using a set of 5′- and 3′- primers as described in Materials and Methods, and the reaction products were run on a 4% Nusieve GTG agarose gel and DNA bands stained by ethidium bromide. Under these conditions, a 174-bp band was detected for a +/+ individual (donor 5), a 142-bp band for Δ32 homozygous individuals (donors 1 and 2), and both 172- and 142-bp bands for heterozygous (+/Δ32) individuals (donors 3 and 4). Lane M shows the molecular weight markers. (B) Assessment of CCR5 expression on blood lymphocytes from +/+, +/Δ32, and Δ32/Δ32 individuals. Lymphocytes from the three types of individuals were stained with the anti-CCR5 mAb 3A9, and analyzed on the FACS®. Dot plots show fluorescence intensity (y-axis) and forward scatter (cell size, x-axis). The horizontal line in each plot indicates the point above which cells were considered positive, based on isotypematched control staining. This level of staining in all three plots resembled the staining of 3A9 shown for the Δ32/Δ32 individual. The staining profiles shown were representative of over 35 analyzed for +/+ individuals, 11 for +/Δ32 individuals, and 4 for Δ32/Δ32 individuals, although variability was observed (see below). (C ) Staining of anti-CD3–activated, rhIL-2–stimulated T cells from +/+, +/Δ32 and Δ32/Δ32 individuals. PBMC were activated with anti-CD3 mAb, and maintained in rhIL-2 for 21 d. Cell size (forward light scatter) is shown on the x-axis, and staining with mAb 3A9 on the y-axis.

