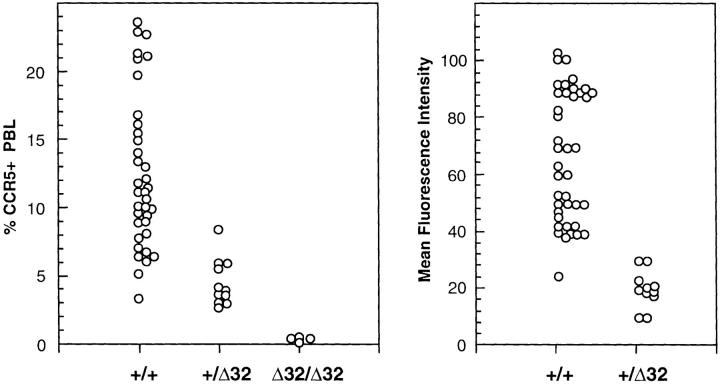
Figure 4.
Heterogeneity of CCR5 expression. Blood lymphocytes from 36 +/+ individuals, 11 +/Δ32 individuals, and 4 Δ32/Δ32 individuals were assessed for percentage CCR5 positive (3A9 staining) cells (left), and MFI of the positive subset (right). Each point represents the value obtained for a single individual. Staining was performed using mAb 3A9, and FACS® analysis. To calculate MFI, the positively stained subset was gated, according to control staining, and MFI was calculated using CellQuest software.

