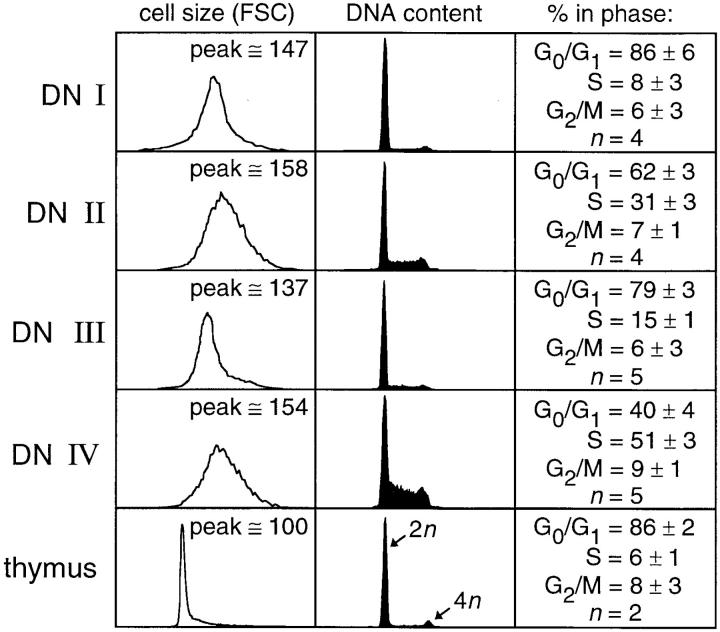
Figure 4.
Cell cycle status of CD4−8− thymocytes. (Left) Relative cell size (forward light scatter) analysis among DN cells gated on CD24, 25, and 44, as appropriate. (Center) PI analysis of DNA content in purified DN subsets I–IV. The relative locations of the diploid (2n) and tetraploid (4n) peaks are indicated on the thymus control. (Right) Pooled cell cycle distributions (mean ± SD) from n experiments, as indicated.

