Figure 8.
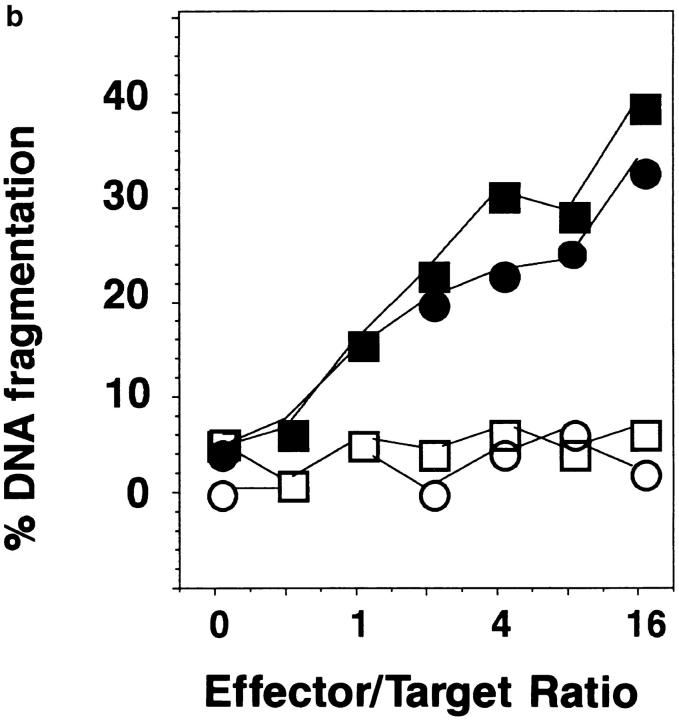
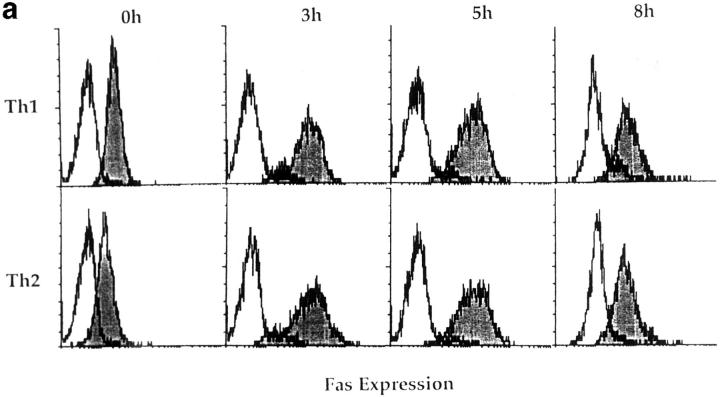
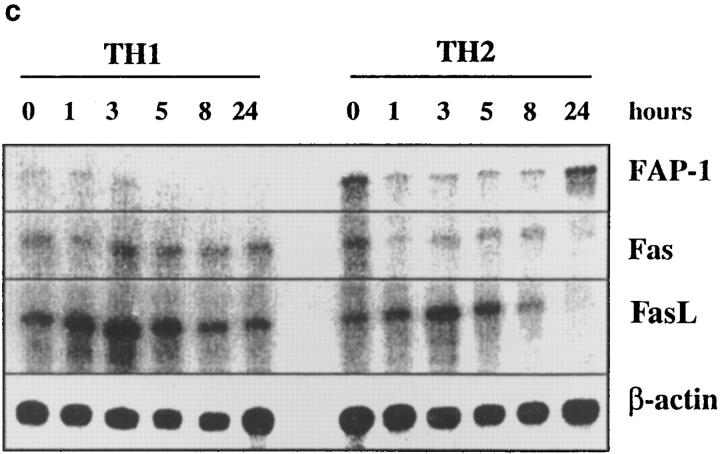
Fas, FasL, and FAP-1 expression in Th1 and Th2 effectors. Th1 and Th2 effectors were generated from naive CD4 cells from AND mice as before, and aliquots were restimulated with PCCF and APC in vitro. Cells were collected at different time points after restimulation. (a) Fas expression by effectors. Th1 and Th2 effector cells restimulated for 0, 3, 5, or 8 h were stained with either hamster anti–mouse Fas antibody (Jo2, shaded peaks) or hamster IgG (open peaks), followed by FL-conjugated goat anti–hamster IgG (Fab′)2 fraction. Cells were counterstained with PE–anti-CD4. Gated CD4+ cells were analyzed for Fas expression by FACScan®, using Lysys II software. (b) Fas-mediated killing by effectors. Functional FasL expression was determined by assessing the ability of Th1 and Th2 effector cells (not restimulated) to cause DNA fragmentation in Fas+ target cells as described in Materials and Methods. Parental L1210 cells (Fas−, ○ or □) or the same line transfected with murine Fas (Fas+, • or ▪) were labeled with 5 μCi [3H]thymidine and used as target cells. 2 × 10⁴/100 μl targets were cultured with 100 μl of appropriately diluted Th1 (○, •) or Th2 (□, ▪) effector cells stimulated with anti-CD3. A1.1 cells, activated by anti-CD3, were used as positive control. The percentage of DNA fragmentation was calculated from thymidine counting with formula. Assays were performed in triplicate and means are shown. (c) Expression of Fas, FasL, and FAP-1 mRNA. RNA was isolated from effectors restimulated with PCCF/APC for 0, 1, 3, 5, 8, and 24 h. An RPA was run on the isolated RNA using a commercial RPA kit (Ambion Inc.) according to the manufacturer's protocol. Fas, FasL, murine FAP-1 cDNA, and β-actin cDNA (positive control), were cloned using pBluescript II. Total RNA was isolated from 10 × 106 Th1 and Th2 restimulated effectors. 10 μg RNA from each sample was hybridized with indicated radiolabeled antisense RNA transcripts, and then digested with RNase A/T1. Samples were then separated by urea/SDS-PAGE and gel was exposed to x-ray film. Results are representative of two similar experiments.


