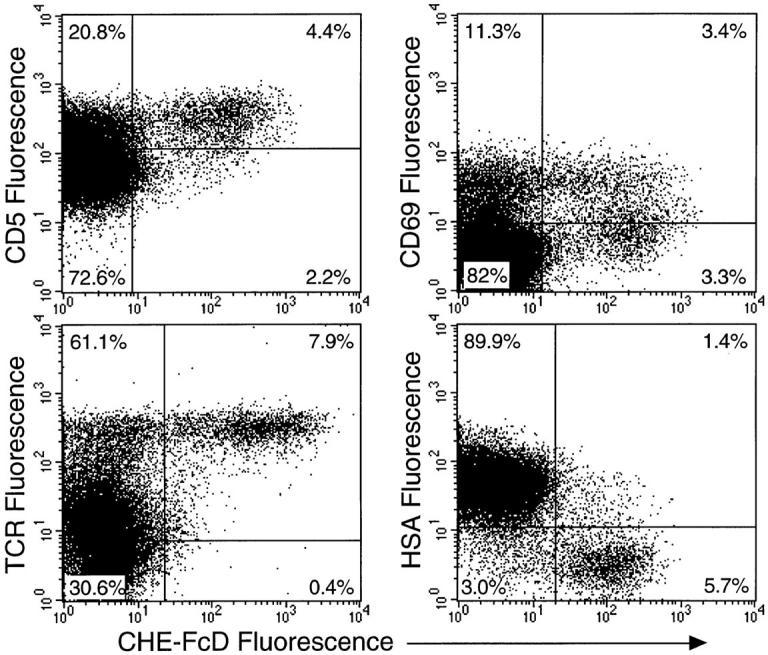
Figure 4.

Relationship of 9-O-acetylation to expression of TCR, HSA, CD69 and CD5 on CD4+ thymocytes. Three-color staining was done with anti-CD4 and CHE-FcD along with either anti-CD3, J11D (anti-HSA), anti-CD69 or anti-CD5 as the third color. Binding of antiCD3 mAb 2C11 was detected using phycoerythrin-conjugated goat anti– hamster IgG and mAb J11D was detected by FITC conjugated donkey anti–rat IgG. Anti-CD69 and anti-CD5 were directly conjugated to FITC and anti-CD4 to tricolor reagent. Only CD4+ thymocytes were gated to show the dot plots relating 9-O-acetylation with other thymocyte markers. Quadrant boundaries were determined based on the background staining profiles obtained by the secondary antibodies for each axis.
