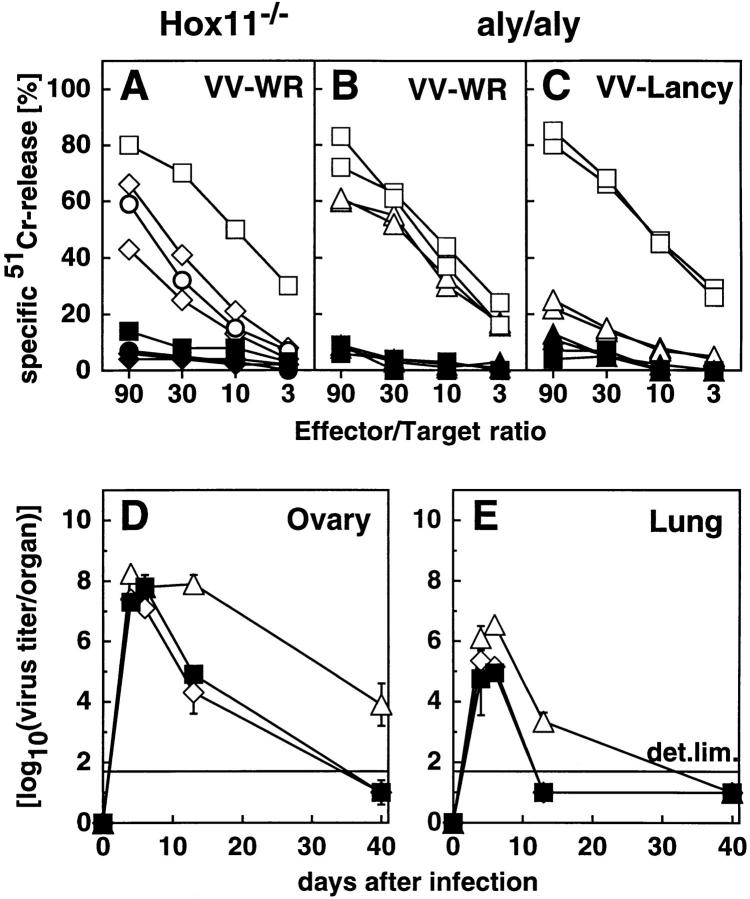
Figure 4.
VV-specific CTL response and VV clearance. Mice were infected with 2 × 10⁶ VV-WR (A, B, D, and E) or VV-Lancy (C). On day 6, spleens and/or LN were removed and directly tested in a standard 51Cr–release assay (A–C). (Open symbols) VV-infected 51Cr-labeled MC57G cells (A–C) as target cells. (Closed symbols) Uninfected target cells. ▵ ▴, aly/aly spleen cells; ⋄ ♦, Hox11−/− LN cells; □ ▪, control B6 spleen cells; ○ •, control B6 LN cells. Each line represents one individual mouse with the exception of the controls in A (squares and circles) where the mean of three mice is shown. D and E show VV titer in ovary and lung given as log10(PFU per organ) at different time points after infection with 2 × 10⁶ PFU VV-WR intravenously. Each line represents the mean and the SD of three mice per group. The detection limit of the assay (det. lim.) is indicated. ▵, aly/aly mice; ⋄, Hox11−/− mice; ▪, B6 control mice. Data of one of two comparable experiments is shown.

