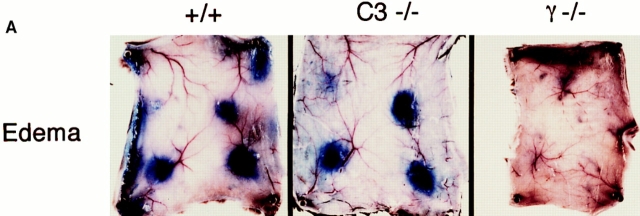
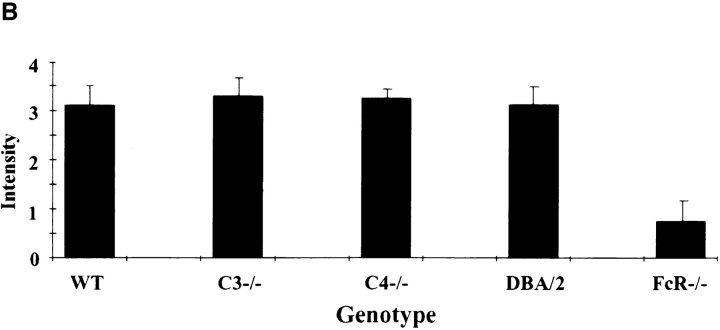
Figure 1.
Quantitation of edema in the reverse passive Arthus reaction. (A) Macroscopic visualization for +/+ (left), complement-deficient (middle), and FcγRdeficient (right) mice. 30 mg of control rabbit IgG (upper left spot) or rabbit anti-OVA IgG was injected intradermally, followed immediately by 2 mg/kg i.v. OVA. Dormal skins were harvested after 2 h, using 1% Evan's blue in the intravenous injectate. (B) Quantitation of edema at 8 h. Microscopic sections were graded for the extent of edema on a scale of 0–4+; n >12 for each genotype, and error bars represent ± SD.


