Figure 6.
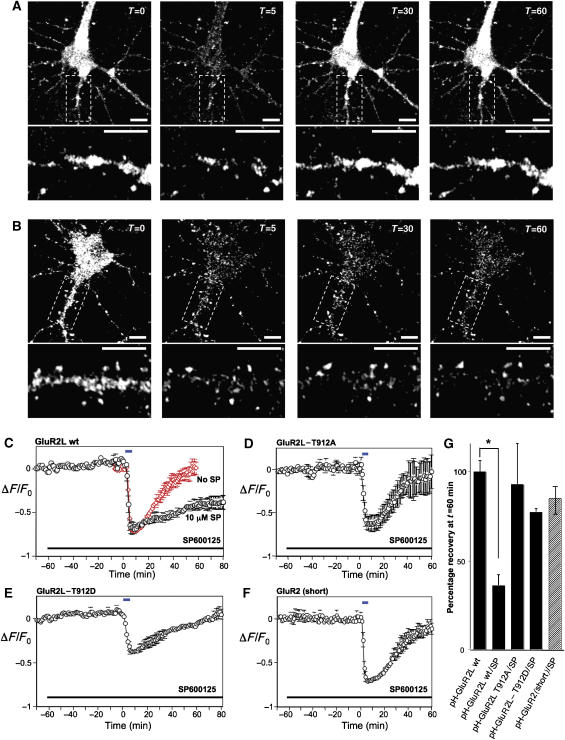
Live imaging of pHluorin-tagged GluR2L (pH-GluR2L) internalization and recycling. (A) Representative images of fluorescence change of a hippocampal neuron expressing pH-GluR2L, exposed at t=0 to 20 μM NMDA for 5 min and then allowed to recover following NMDA washout. Lower panels show enlargements of the dendritic region boxed in the upper panels. Scale bars=10 μm. As reported elsewhere (Ashby et al, 2004), NMDA perfusion predominantly internalizes diffuse, extra-synaptic AMPA-Rs. The signal:noise ratio of dendritic fluorescence change is thus less robust, due to the contribution of clustered/punctate pHGluR2L that does not internalize following NMDA treatment. (B) As A, but for a neuron incubated for 1 h in the presence of 10 μM SP600125 prior to NMDA treatment. SP600125 was present during NMDA treatment and recovery. (C) Fluorescence change (mean±s.e.m.) during initial incubation, perfusion with 20 μM NMDA for 5 min at t=0 min (blue bar) and washout, plotted for neurons in the presence of DMSO vehicle (red diamonds) or 10 μM SP600125 (black circles). SP600125 was present as indicated (black bar). (D) As C, but for neurons expressing pH-GluR2L-T912A. (E) As C but for neurons expressing pH-GluR2L-T912D. (F) As C, but for neurons expressing pH-GluR2(short). Data in A–E are plotted as mean±s.e.m. for the following number of individual cells, from at least two platings of neurons: GluR2L wt: N=8; GluR2L wt+SP: N=5; GluR2L T912A: N=3; GluR2L T912D: N=5; GluR2 (short): N=4 (G) Fluorescence recovery, quantitated 1 h after NMDA washout in B–E (*P<0.01, Student t-test).

