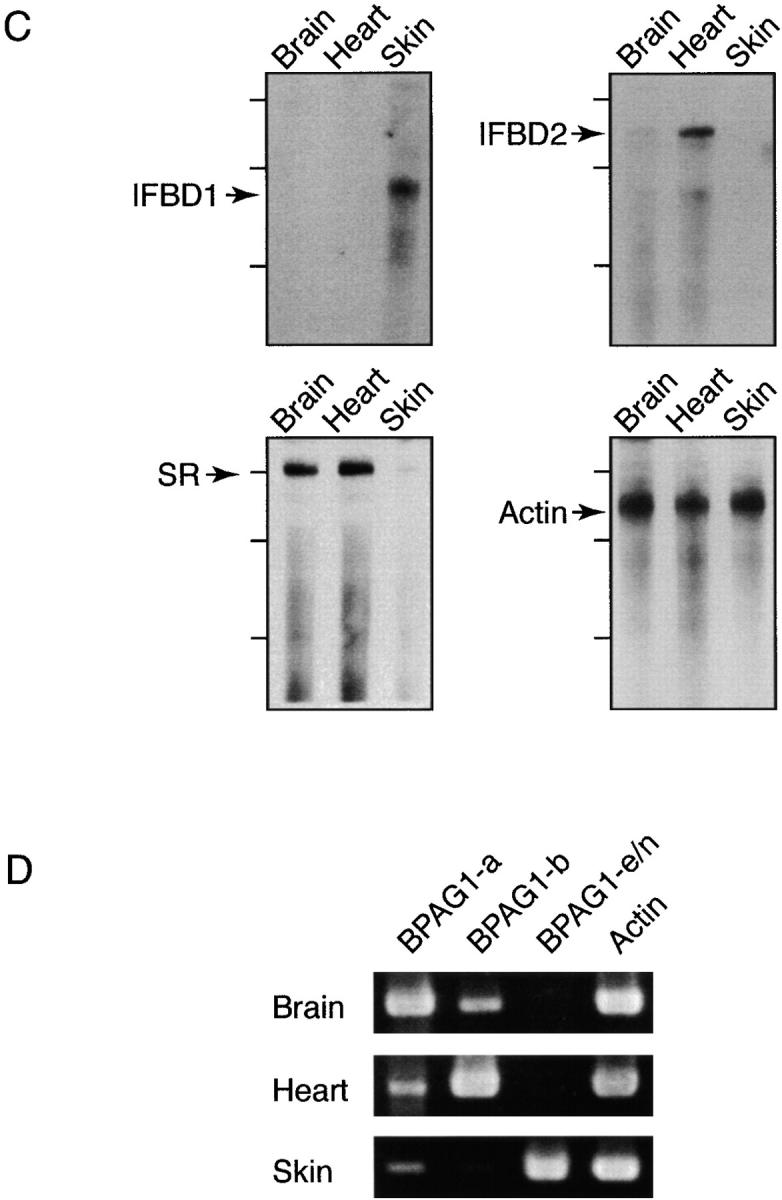
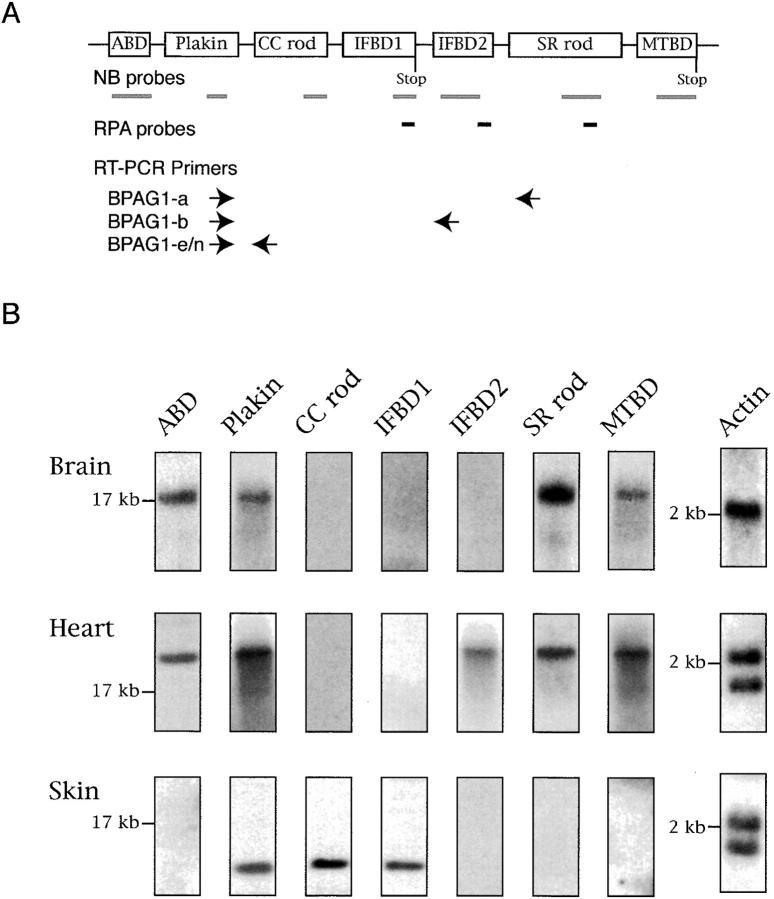
Figure 3.

Analyses of BPAG1 mRNAs. (A) A schematic diagram showing the structure of the BPAG1 gene. Bold gray lines underneath individual domains represent the probes used for Northern blot (NB) analysis and in situ hybridizations. The positions of riboprobes (bold lines in black) used for RPA and oligonucleotide primers (arrows) used for RT-PCR analyses are illustrated. The names of the riboprobes corresponded to the BPAG1 structural domains that the riboprobes recognized. The primer sets were named after the BPAG1 isoforms that they amplified. (B) Northern blot analysis of BPAG1 isoforms. The positions of the 17-kb brain MACF mRNA and the 2-kb RNA standard are marked. The β-actin probe also detected other actin isoforms. (C) RPA analysis of BPAG1 isoforms. BPAG1 isoforms that contained the IFBD1 domain were only detected in skin. BPAG1-b transcripts that could be protected by IFBD2 probe were found in large amounts in the heart and small amounts in the brain. The SR-containing rod domain probe that protected both BPAG1-a and BPAG1-b mRNAs gave strong signals in brain and heart and weak signals in skin. Marker standards (100, 200, and 300 bp) are indicated on the left of each panel. (D) RT-PCR analyses of BPAG1 isoforms. The highest amounts of BPAG1-a and BPAG1-b were observed in brain and heart, respectively. BPAG1-e mRNAs were only found in the skin, whereas no BPAG1-e/n mRNAs were detected in the brain or the heart with these RT-PCR settings.

