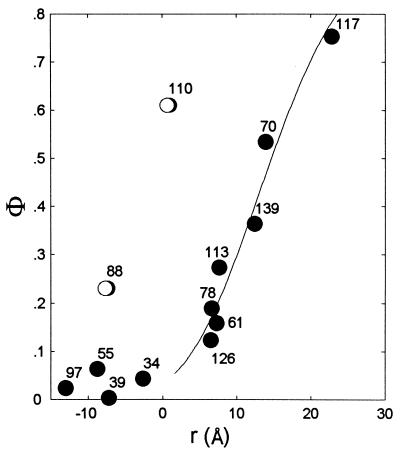
Figure 1.
Regression analysis of the C2cPLA2-membrane orientation. The solid line shows values of simulated Φ obtained by using the nonlinear Poisson–Boltzmann equation as a function of distance from the spin label nitrogen to the membrane (r). The circles are the values of Φ calculated from the experimental EPR data as a function of the modeled distance from the spin label to the membrane for each residue (the residue number is shown next to each circle). Residues 34, 39, 55, and 97 are all close to the membrane, and those that penetrate the interior of the bilayer were distinguished by the oxygen effect (see text).

