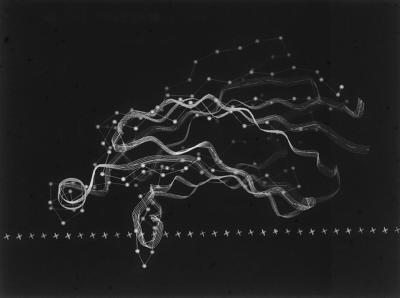
Figure 3.
Comparison of the optimal C2cPLA2-membrane orientation (given by the fit in Fig. 1, ribbon diagram), which excludes data from residues 88 and 110, to that given by the alternative regression fit described in the text (ball-and-stick diagram). The membrane planes of the two docked structures are superimposed and shown edge on as a row of crosses.

