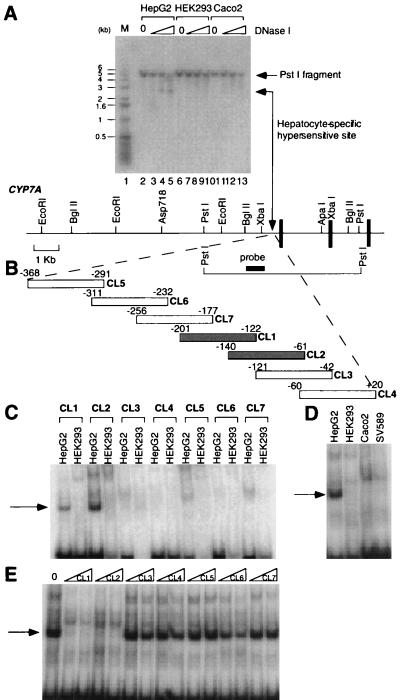
Figure 1.
A hepatic-specific DNase I-hypersensitive site in the CYP7A promoter region. (A) DNAs prepared from DNase I-treated nuclei (0, 0.6, 1.7, or 5.0 units/ml) from HepG2, HEK293, and Caco2 cells were separated by 1.0% agarose gel electrophoresis and subjected to Southern hybridization. A radio-labeled fragment corresponding to base pairs −944 to −468 of the CYP7A gene was used as a probe. A 5.0-kb PstI fragment was observed in each lane. A 2.8-kb hepatic-specific fragment (lanes 3–5) is indicated by the double arrow. The lane that displays molecular size markers is indicated by M and contains the 1-kb ladder (GIBCO/BRL). The sizes (in kb) of bands of the 1-kb ladder are indicated at the left of the gel. Below the gel is diagrammed a partial restriction map of the promoter region. The vertical bars represent exons 1–3 of the CYP7A gene. The arrow between the XbaI site and the first exon represents the location of the hepatic-specific DNase I-hypersensitive site. The heavy horizontal bar denotes the location of the probe used in this experiment. The 5.0-kb PstI fragment is also diagrammed. (B) A schematic diagram indicating the location of double-stranded oligonucleotides CL1–CL7 within the CYP7A promoter region that were used as radio-labeled probes. +1 denotes the transcription start site. (C–E) Formation of hepatic-specific DNA-protein complexes. EMSAs were performed with the indicated nuclear extracts and radio-labeled, double-stranded CL1–CL7 oligonucleotide probes diagrammed in B. (C) EMSAs were performed by using nuclear extracts prepared from HepG2 and 293 cells. The arrow indicates the hepatic-specific DNA-protein complex. (D) Nuclear extracts from the indicated cell lines were used in EMSAs with CL1 as the radio-labeled probe. The arrow indicates the hepatic-specific DNA-protein complex. (E) Competition EMSAs using unlabeled CL1–CL7 fragments as competitors. An EMSA was performed by using HepG2 nuclear extracts and radio-labeled CL1 with the addition of either a 30- or 60-fold molar excess of unlabeled CL1–CL7 (indicated by triangles at the top of the gel lanes). The DNA-protein complexes are indicated by the arrows. 0, no competitor.

