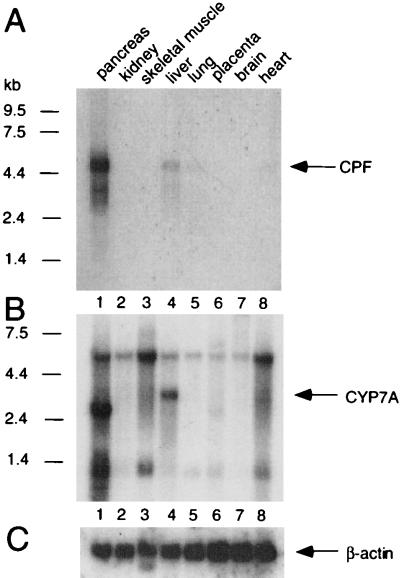
Figure 7.
Tissue blot analyses of CPF and CYP7A mRNA expression. (A) The tissue blot was hybridized with radio-labeled CPF cDNA. (B) The same blot was stripped and rehybridized either with a riboprobe derived from CYP7A cDNA or with (C) radio-labeled β-actin cDNA as a control. Molecular size markers (in kb) are shown at the left of A and B.

