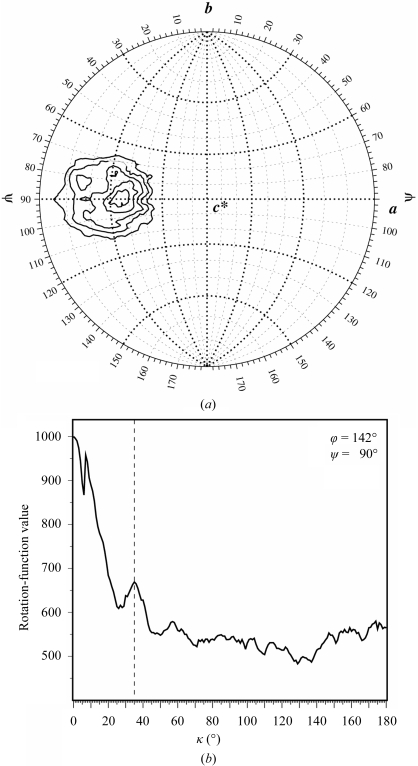
Figure 5.
Self-rotation function calculated using GLRF (Tong & Rossmann, 1997 ▶) with an integration radius of 15 Å and data in the resolution range 30–2.5 Å. (a) The κ = 36° section. Contour lines are drawn at intervals of 2σ starting from 16σ. The peak at (ϕ, ψ) = (142, 90°) is observed in all κ sections between 0 and 180° and is consistently present in self-rotation functions calculated using various high-resolution cutoffs (2.5–5 Å) and integration radii (10–25 Å). (b) Scan along κ showing the local maximum at 35°.

