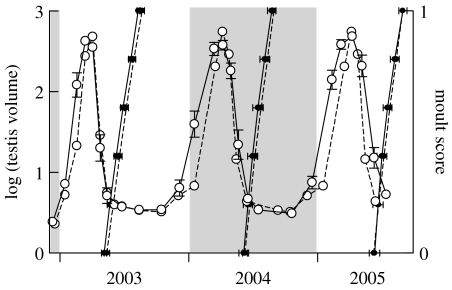
Figure 4.
Changes in testis volume (open circles, left axis) and the occurrence of moult (solid circles, right axis) in photoperiodic cycles simulating 9 °N and 52 °N. Mean±s.e. values for the 12 individual birds shown in figure 3 that were held on a simulated 9 °N photoperiodic regime (solid lines) superimposed on values for 12 control birds (broken lines) held on a photoperiodic regime simulating 52 °N (an amplitude of 9 h, i.e. a mid-winter photoperiod of 7.5 L : 16.5 D and a mid-summer photoperiod of 16.5 L : 7.5 D). Mean and s.e. for moult were calculated by regressing day on moult score (Dawson & Newton 2004). The timing of testicular maturation was slightly advanced in the second two cycles in the 9 °N birds, but the time of regression and moult was exactly the same as in the 52 °N birds.

