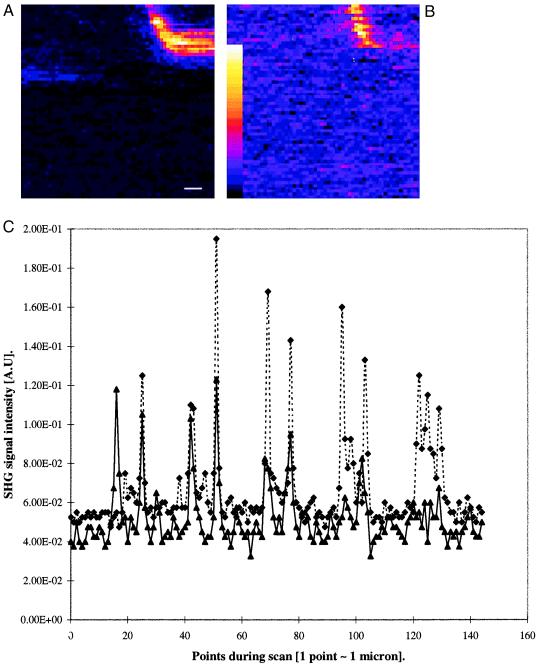
Figure 5.
One-nanometer gold-labeled and JPW 1259-stained cells as in Fig. 3 imaged by second harmonic microscopy before (A) and after (B) depolarization of the cell membrane. (C) To facilitate assessment of the potential dependence of SHG, a plot of intensities taken from a string of pixels in the 64 × 64 images before (dotted line) and after (filled line) membrane depolarization. The pixels chosen for this plot include horizontal rows 12–17 that are plotted in this graph as one continuous line; high-intensity spikes correspond to cell membrane regions near a gold particle.

