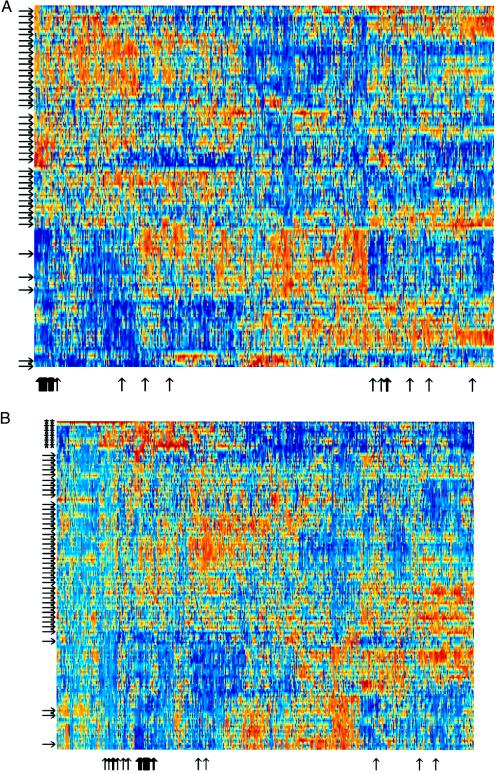
Figure 3.
(A) Expanded view of clustered data set of 2,000 genes in 22 normal and 40 tumor colon tissues. The genes chosen are the 2,000 genes with highest minimal intensity across the samples. Tumor tissues are marked with arrows on the left. Normal tissues are unmarked. Note the separation of normal and tumor tissues. Thin black vertical arrows on the bottom mark ESTs homologous to ribosomal proteins (see Table 1). Note that where these genes cluster the arrows group together and resemble a thick arrow. (B) Same as A but with EB and EB1 colon carcinoma cell lines (17) added to the data set (marked with ∗∗). Note the clustering of cell lines into a separate group with expression patterns markedly different from both tumor and normal in vivo tissues.

