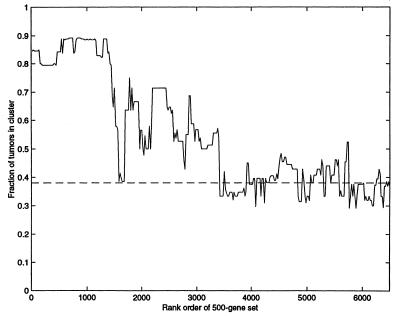
Figure 5.
Separation of tumor and normal tissues by clustering over a set of 500 genes. Genes were sorted by statistical significance (t test) of the difference in normal and tumors. Tissues were clustered by using a window of 500 genes selected from the sorted genes. The vertical axis denotes the fraction of tumors in the tumor rich cluster (|T − N|/(T + N) where N and T are the number of normal, tumor tissues). Dashed line indicates separation in a randomized data set. The horizontal axis denotes the starting point of the 500-gene window, so that at the left-hand side the most significant 500 genes are used, and at the right the least significant 500 genes.

