
Figure 7.
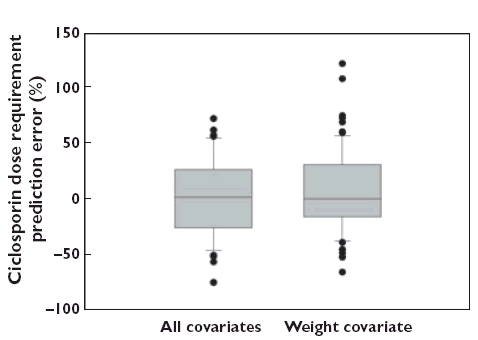
Box and whisker plots of the prediction errors for oral dose requirements calculated using the population model and (A) all covariate information (body weight, serum creatinine, haematocrit and total plasma cholesterol) in the population model and (B) the body weight covariate alone to achieve a ciclosporin exposure of 2500 µg l−1 h. The oral doses were calculated as follows: (A) dose requirement by all covariates = AUC × Typical value of clearance (including all covariates)/Typical value of oral bioavailability; (B) dose requirement by body weight = AUC × Typical value of clearance (including the body weight covariate only setting the other covariates to median values)/Typical value of oral bioavailability. Relative prediction error (%) = (calculated dose − true dose requirement*)/true dose requirement × 100%. The whiskers above and below indicate the 10th and 90th percentiles, the boundaries of the box indicate the 25th and 75th percentiles, the line in the middle indicates the median value and the outliers are plotted separately. *True dose requirement = AUC × individual Bayesian estimate of clearance/individual Bayesian estimate of oral bioavailability