
Figure 3.
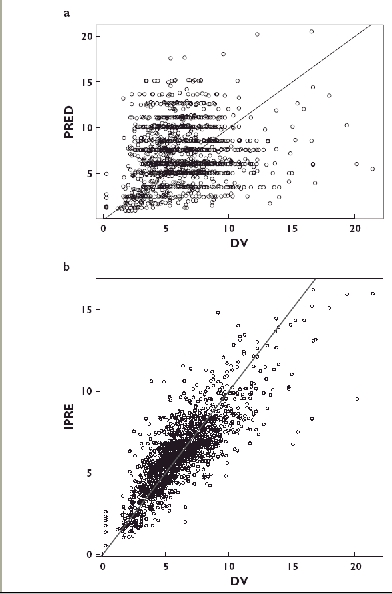
a) Model-predicted (PRED) vs. observed (DV) trough whole blood tacrolimus concentrations (ng ml−1). The solid line is the line of identity. The mean bias (± SD) was −0.64 (± 3.7) ng ml−1, not significantly different from 0. b) Individual model-predicted (iPRED) vs. observed (DV) trough whole blood tacrolimus concentrations (ng ml−1). The solid line is the line of identity. The mean bias (± SD) was −0.02 (± 1.52) ng ml−1, not significantly different from 0