Figure 2.
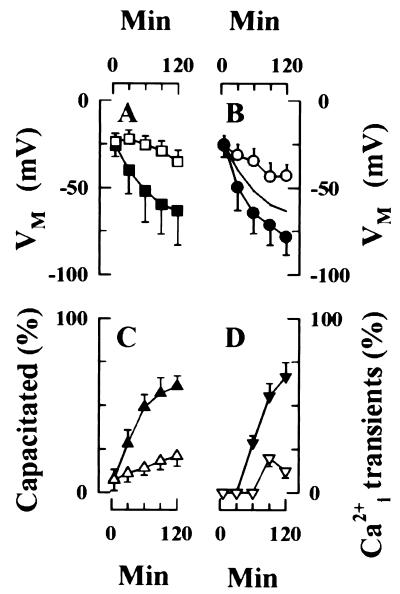
Capacitation results in membrane hyperpolarization. (A) Hyperpolarization of sperm populations during capacitation. VM values of immobilized sperm were calculated from di8-ANEPPS emission of single cells during a 120-min incubation under conditions that do (■, 75 cells) or do not support capacitation (□, 61 cells). Data are the mean (±SD) of 5–8 different experiments and entail determinations from the indicated number of cells. (B) Membrane hyperpolarization is associated with capacitation. Capacitation state of individual sperm was determined by ability of sperm to initiate exocytosis during a subsequent challenge with ZP. Data from 75 cells were summed to assemble population VM values (—; redrawn from A), as well as from the subpopulations that are (●) or are not (○) capacitated by 120 min. Strong hyperpolarization is restricted to the subpopulation of sperm that capacitate. (C) The time course of capacitation was determined by CTC fluorescence emission. Motile sperm were incubated in a capacitating medium (▴) or in a medium that does not capacitate mouse sperm efficiently (▵). Data are the mean ± SD of triplicate experiments, with 200 sperm assayed/time point in each experiment. (D) Sperm develop the ability to generate ZP/ZP3-dependent Ca2+i transients during capacitation. Sperm were incubated for the indicated times either in a capacitating medium (▾) or in a noncapacitating medium (▿), as described in C and were stimulated with either ZP (40 μg/ml) or ZP3 (10 μg/ml), and Ca2+i responses were recorded. Data represents mean (±SD) of observations on 3–8 cells, with ZP- and ZP3-stimulated responses pooled for presentation.

