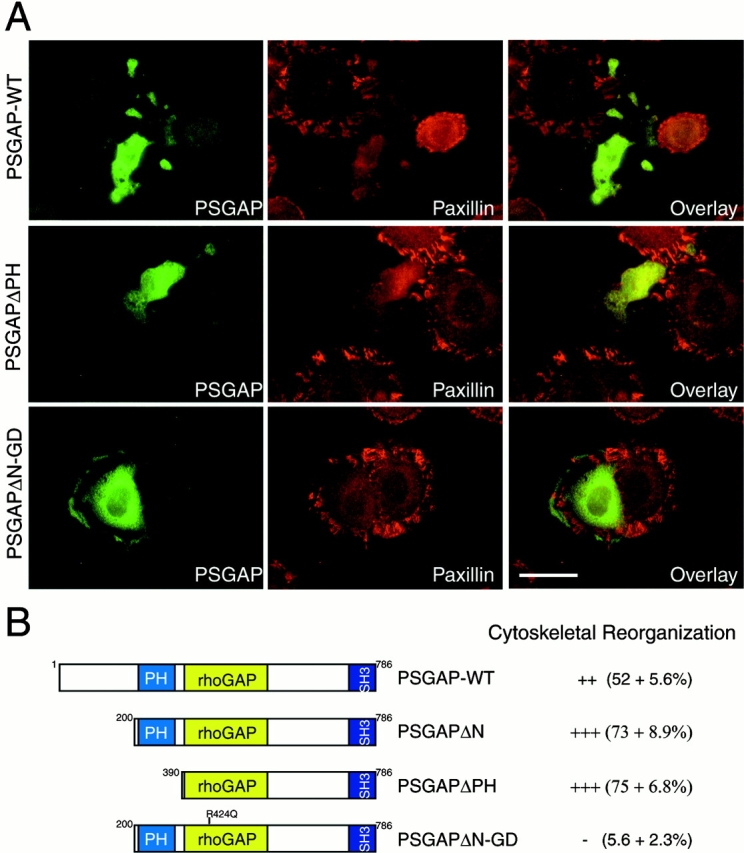
Figure 11.

Cytoskeletal reorganization in fibroblasts expressing PSGAP. (A) 10T1/2 cells were transfected with the indicated constructs and stained with anti–PSGAP (green) and anti–paxillin (red) antibodies. Bar, 50 μm. (B) Schematic representation of PSGAP and PSGAP mutants. The numbers represent the amino acid residues deleted from PSGAP-m. The PH domain, rhoGAP domain, and SH3 domain are indicated. Cytoskeletal reorganization index (mean ± SEM) was determined by counting the morphologically altered PSGAP-expressing cells divided by the total number of PSGAP-expressing cells, and listed at right.
