
Figure 1.
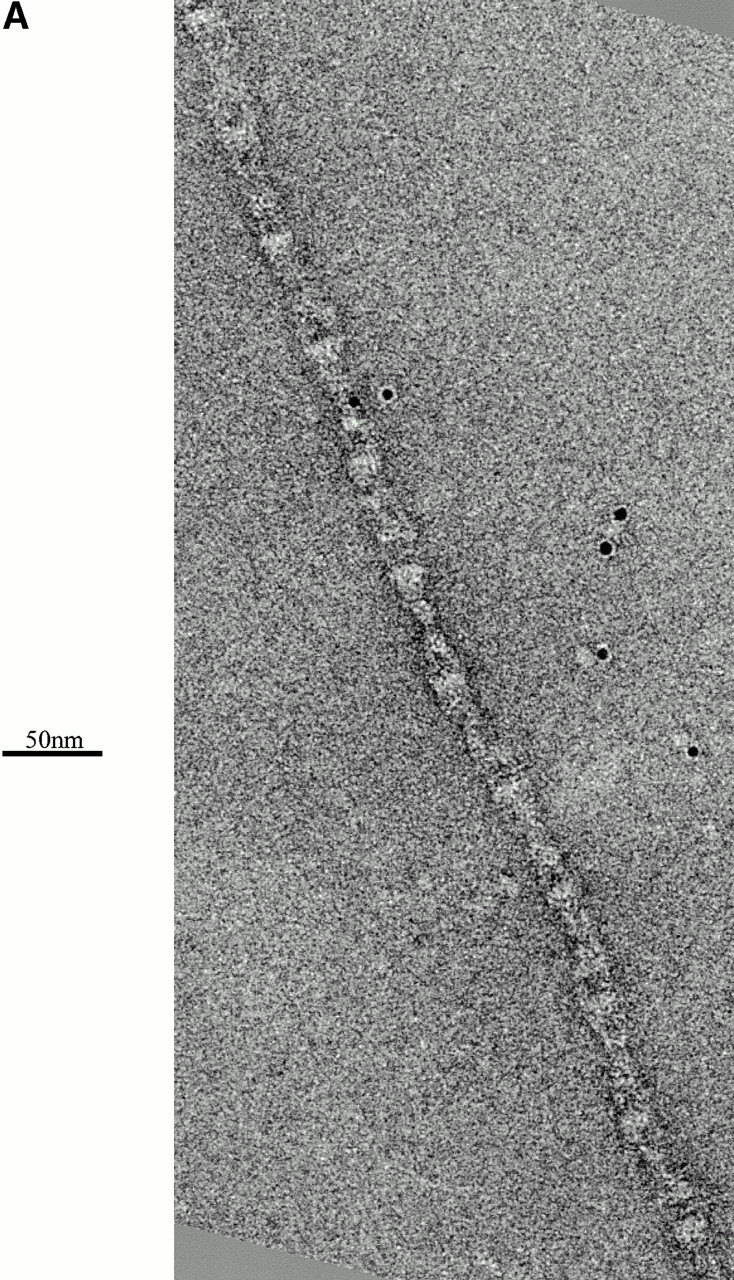


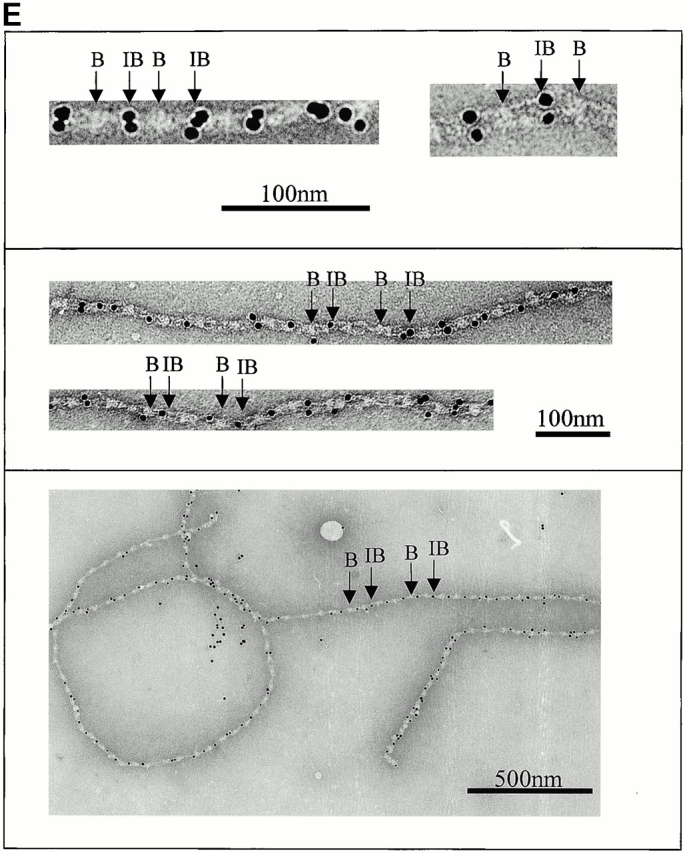
Automated electron tomography images of negatively stained untensioned bovine zonular microfibrils. (A) A zero degree tilt image of a negatively stained microfibril. (B) XY slices at six different Z heights through a reconstruction showing a region of the same microfibril. Stain-penetrable space between the arms is seen in all Z slices and is therefore a 3-D feature. (C) Three Z slices shown in black and white using IMOD (Kremer et al.. 1996) compared with the same region of microfibril 3-D volume rendered (green) using AVS Express (Advanced Visual Systems Inc.). (D) Schematic diagram of a microfibril repeating unit with the mean measurements taken from a representative data set. For standard deviations, see Table . (E) Colloidal gold binding to microfibrils, showing periodic double labeling at the ends of the interbead arms, and intermittent labeling at the bead. Beads and interbeads are labeled B and IB, respectively.