
Figure 4.
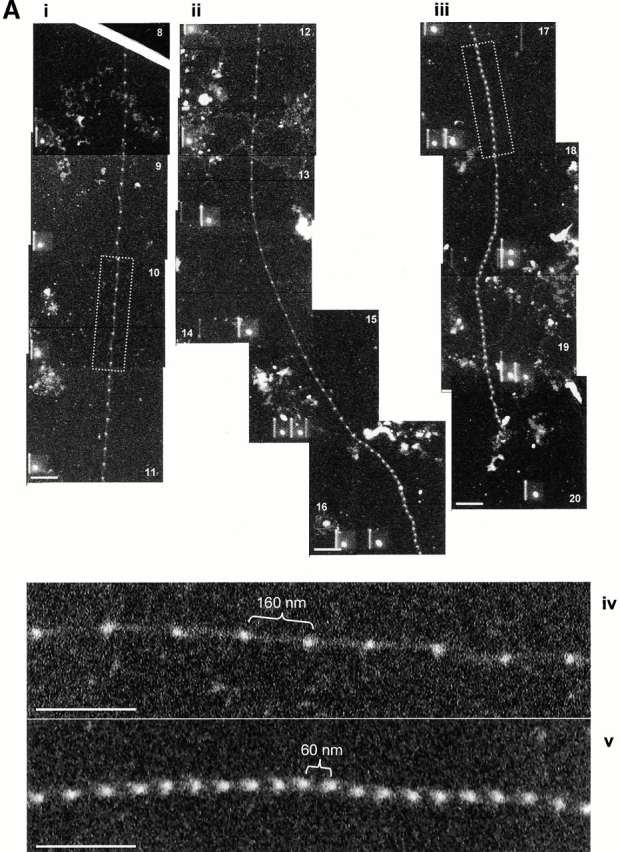
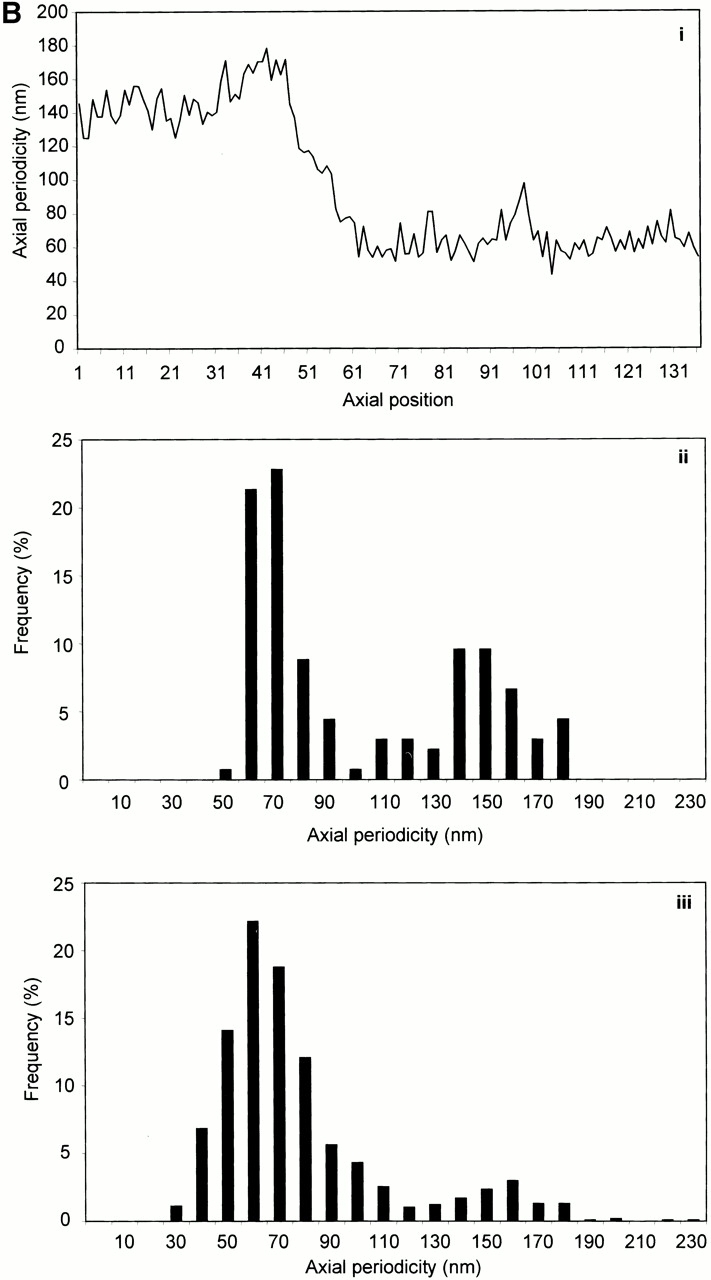
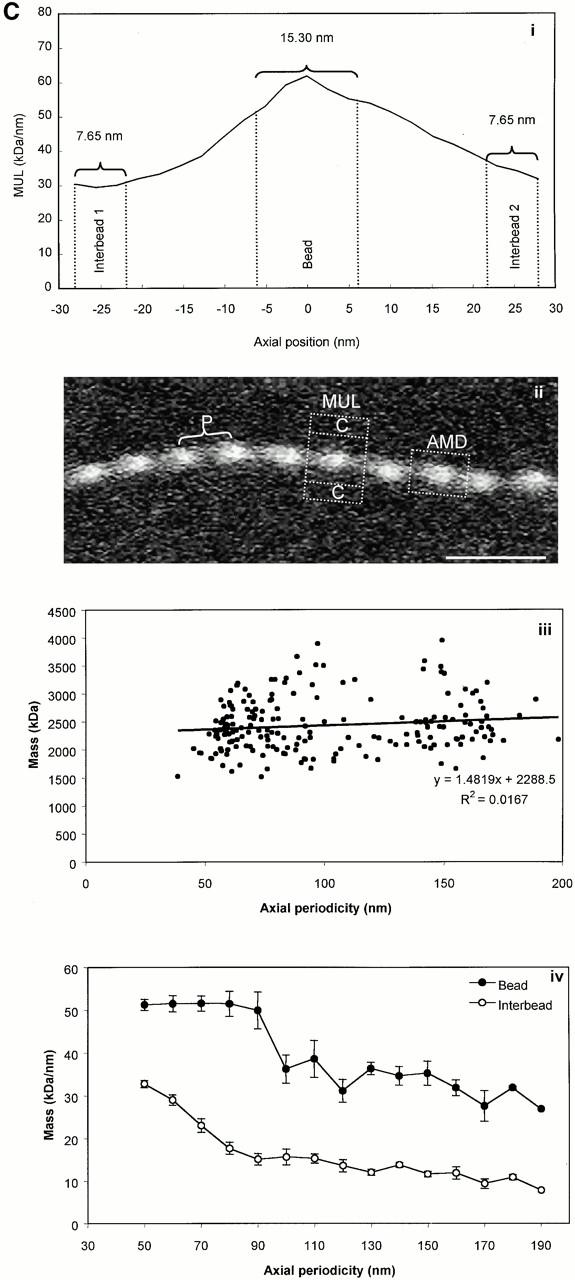
STEM mass mapping of untensioned and stretched microfibrils. (A) Dark-field STEM composite of a single highly stretched fibrillin-rich microfibril isolated from canine zonules (i, ii, and iii). (iv and v) High magnification sections of the regions indicated by boxes in i and iii. Microfibril periodicity varied from 160 (iv) to 56 (v) nm with a short sharp transition zone. (B, i) Bead-to-bead periodicity for the microfibril illustrated in a. (ii) The frequency of periodicity for this microfibril peaks at 60–70 and 140–150 nm. (iii) Frequency distribution of periodicity for the whole population of canine ciliary zonule microfibrils. (C, i) The central bead and interbead mass measurement positions. Total mass per repeat was calculated for each repeat from the product of the periodicity and the MUL. The area under the curve of the axial mass distribution was adjusted to equal the total mass per repeat and the mean MUL of the central bead region was calculated over an axial extent of 15.30 nm. The mean MUL of the interbead region was calculated from the mean MUL of the areas designated Interbead 1 and Interbead 2. (ii) Dark-field image of a canine ciliary zonule microfibril. Periodicity (P) was determined for each bead–bead region within all microfibrils, and C is the carbon film background. Mean MUL was calculated for selected beads covering a range of periodicities. (iii) Total mass per repeat is invariant with changes in periodicity. (iv) Variations in mean central bead and central interbead mass with periodicity. Error bars = SEM.