Figure 4.
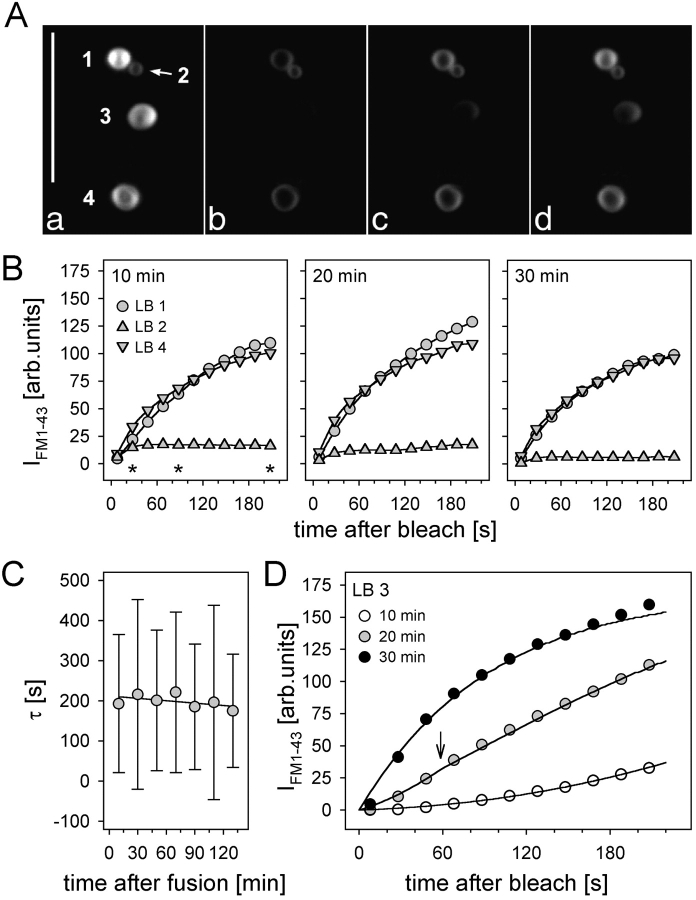
Late states of fusion pores. (A) LSM images of fused LBs at the cell periphery before (a) and at different times (b–d, corresponding to the asterisks in B; bleaching was at time 0) after a FRAP measurement. (B) Minor changes in IFM 1–43 recovery rates of LBs 1, 2, and 4, measured at ∼10, 20, and 30 min after initial fusion. (C) Mean time constants of individual LBs (n = 8 ± SD) after repeated FRAP measurements. (D) Progressive increase in IFM 1-43 recovery of LB no. 3 in A within three subsequent measurements. Data were fit by Eq. A4 (solid lines). Arrow denotes transition of the fusion pore diameter (see text). Bar, 10 μm.

