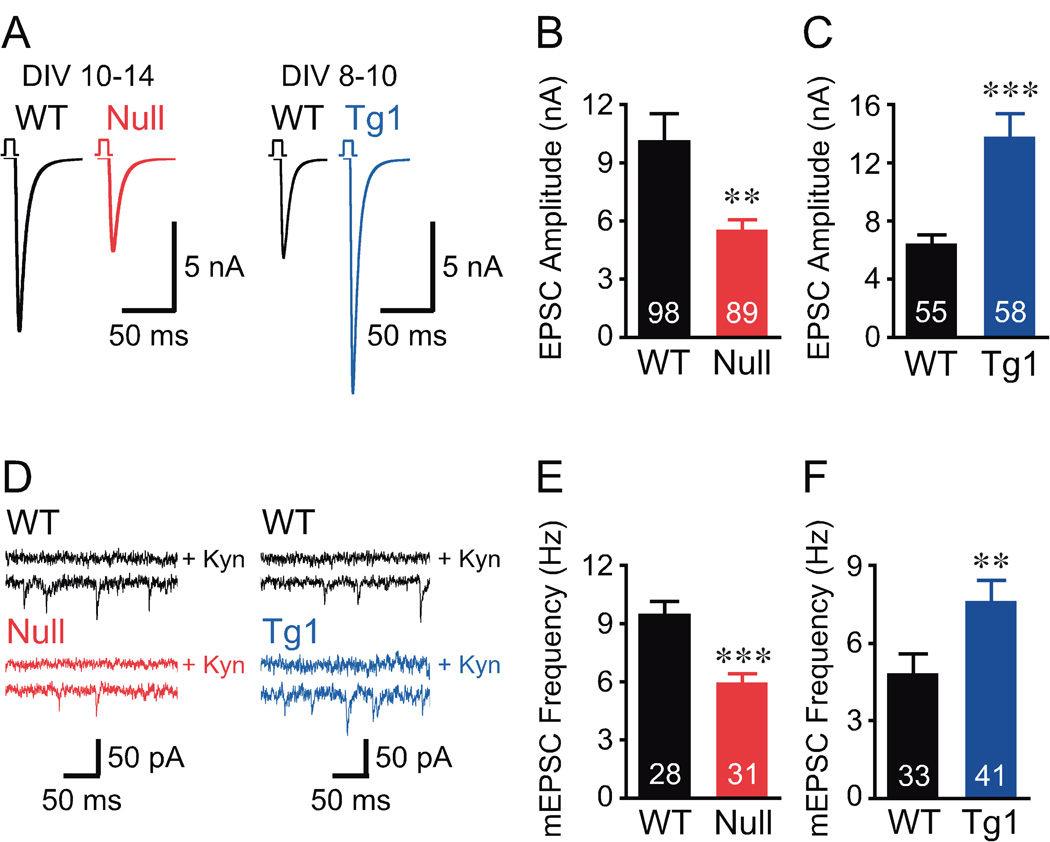
Figure 1. Loss or doubling of MeCP2 alter the magnitude of evoked EPSCs and frequency of spontaneous mEPSC events.

(A) Mean action potential evoked EPSC trace from data shown in (B, C). Data collected at an earlier time point for Mecp2Tg1 neurons to reduce voltage clamp errors. (B, C) Bar graphs show EPSC amplitude. (D) Representative mEPSC traces with upper trace in the presence of 3 mM glutamate receptor blocker, kynurenic acid (Kyn). (E, F) Bar graphs show mEPSC frequency. Number of neurons analyzed (n) shown in the bars. Data shown as mean ± SEM. ** P<0.01, *** P<0.001
