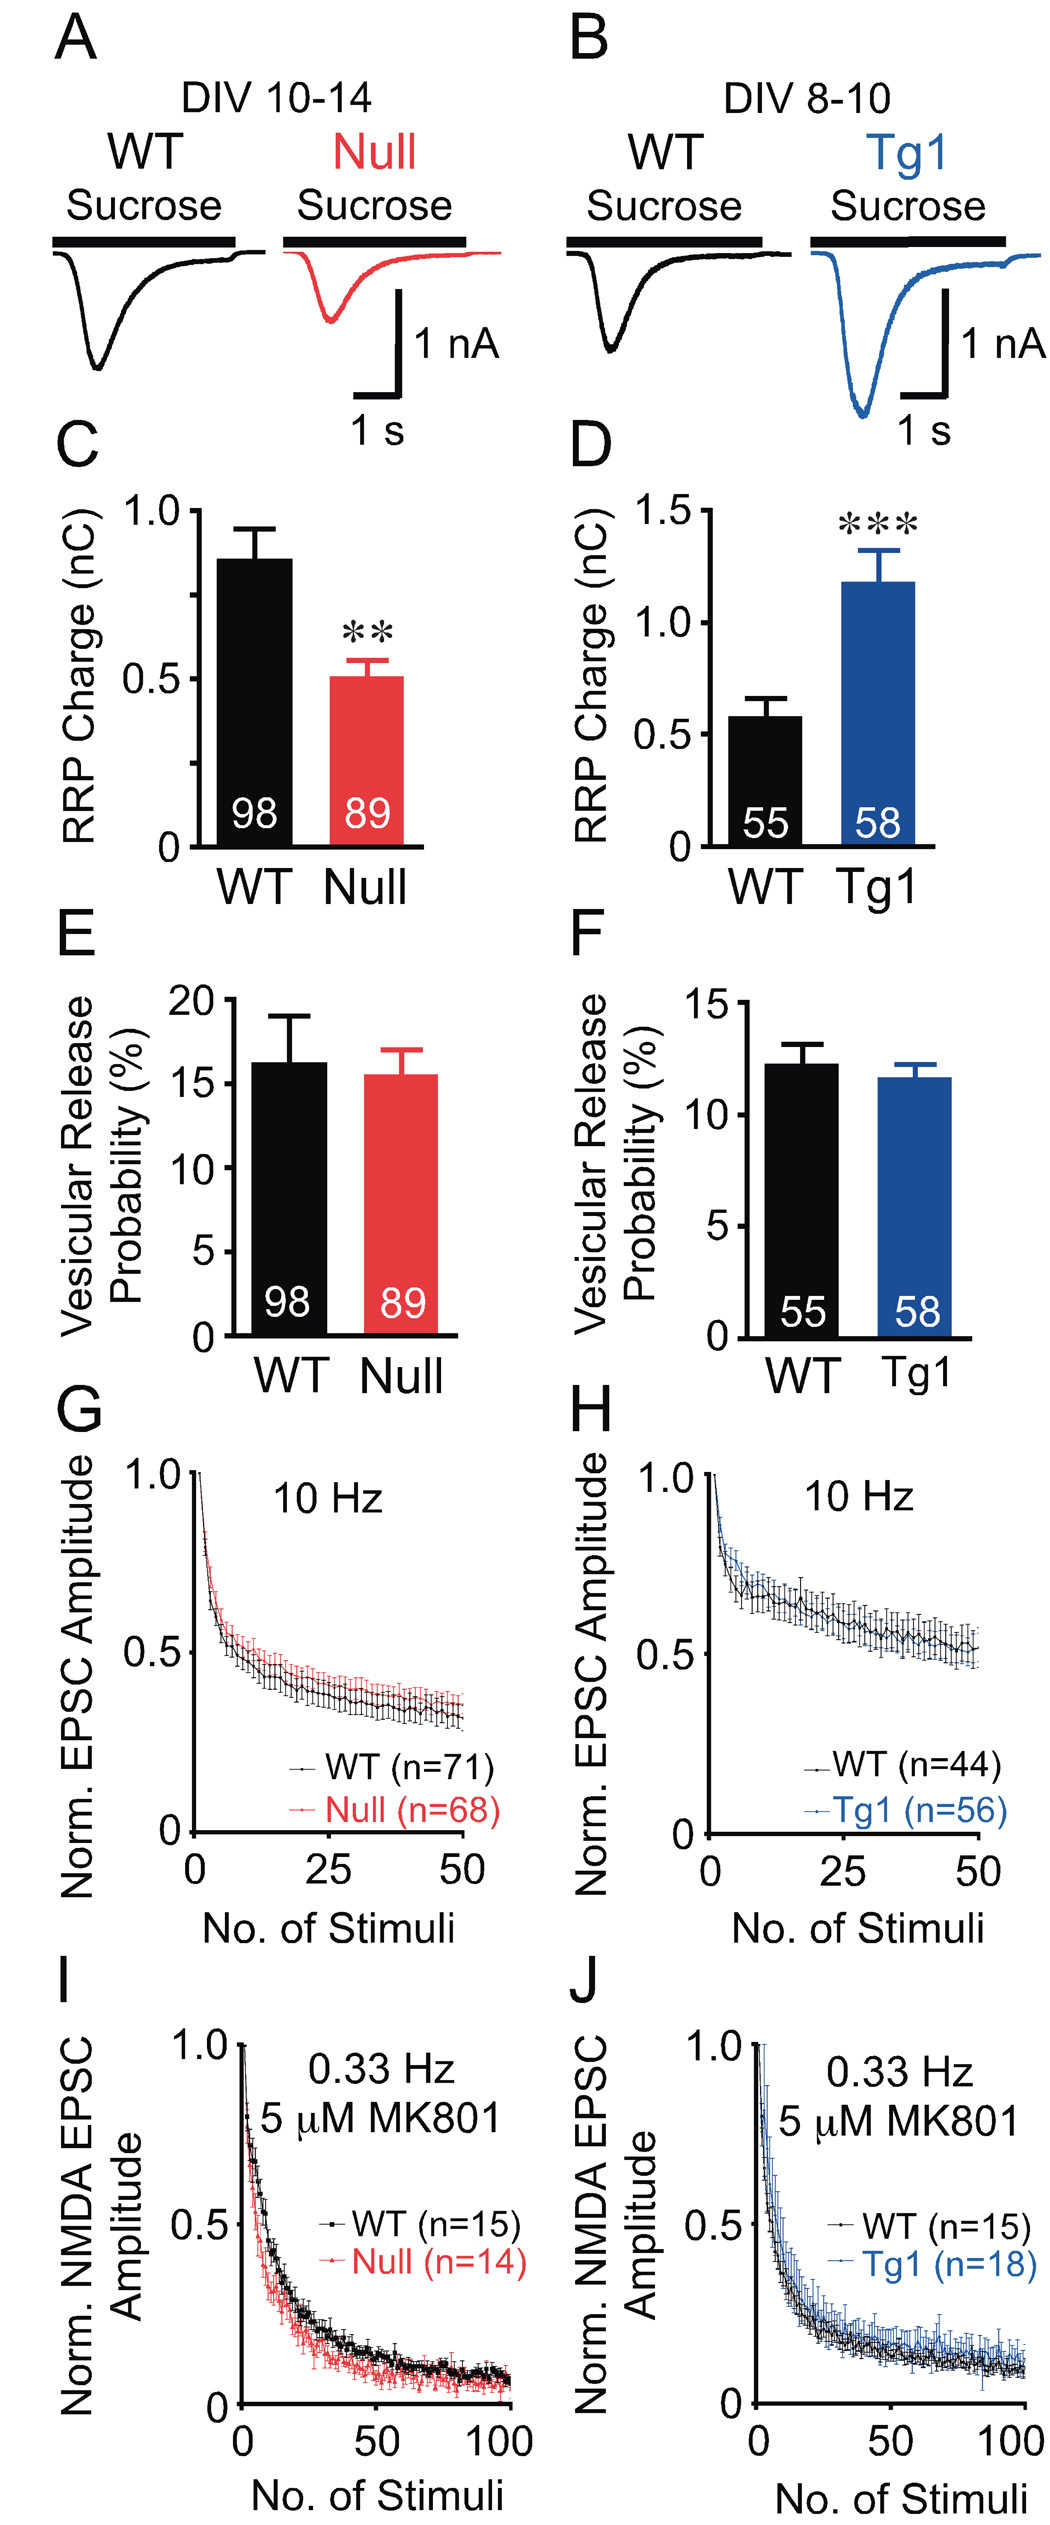
Figure 2. Loss or doubling of MeCP2 alter the magnitude of the RRP, without altering short-term plasticity and synaptic release probability.

(A, B) Average current response to 4 s application of sucrose from data shown in (C, D). (C–F) Bar graphs show RRP size (C, D) and Pvr (E, F). Number of neurons analyzed (n) shown in the bars. (G, H) Normalized EPSC amplitude with train stimulation. (I, J) Normalized NMDA-EPSC amplitude with 5 µM MK801. Data shown as mean ± SEM. ** P<0.01, *** P<0.001
