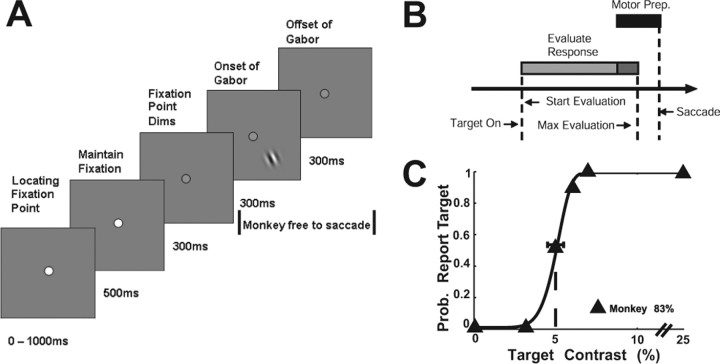
Figure 1.
Visual detection task. A, The monkey initially shifted gaze to a fixation point at the center of the screen. The fixation point then dimmed. Three hundred milliseconds later, a target could appear in the periphery. The monkey was allowed to make a saccade to the target location as soon as it had detected the target. Three hundred milliseconds later, the target was extinguished, but the monkey could still make a saccade to the target for another 300 ms. B, Time line for computing mean firing rates and spike counts. Mean firing rates and spike counts were computed over a period starting 36 ms after target onset and ending 20 ms before the monkey's saccade to the target [allowing for motor preparation (Motor Prep.) time] or 200 ms [maximal (max) integration time] after target onset, whichever came first. In this example, the rate/count was computed over just the light gray bar. The dark gray bar shows the overlap between the maximal integration interval and the motor preparation interval (black bar). C, Psychometric function describing how often the monkey reported the presence of the Gabor target as a function of the contrast of the target. The solid line is the best-fit Weibull function (see Materials and Methods). The dashed vertical line indicates the monkey's threshold. Note that threshold is defined as the contrast at which performance is 75% correct combined across target-present and target-absent trials. Because the false-alarm rate in this experiment was close to zero, threshold is the contrast at which the hit rate was ∼50%. The horizontal error bar is a 95% confidence interval of the threshold based on a bootstrap analysis (see Materials and Methods). The overall accuracy of the monkey in this experiment is indicated. Prob., Probability.

