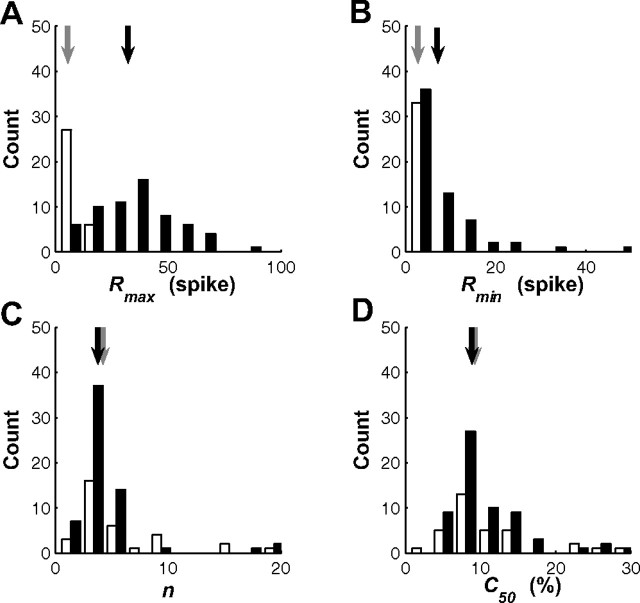
Figure 10.
Comparison of contrast response function parameters for SU and MU. Mean response as a function of contrast was fitted for each SU and MU site using a Naka-Rashton contrast response function (see Results). A, Histogram of Rmax values. Open bars, SU; filled bars, MU. Gray arrows indicate median value for SU; black arrows indicate median value for MU. B, Histogram of Rmin values. C, Histogram of the exponent n. D, Histogram of half-saturation constant C50. B–D have the same conventions as in A.

