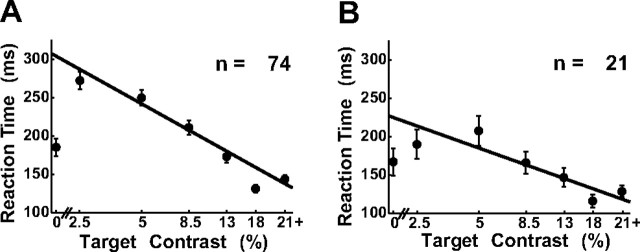
Figure 2.
Mean RTs. A, Mean RTs as a function of binned target contrast collapsed across all experiments (n = 74). Data points lie in the middle of the bin. B, Mean RTs for experiments in which the false-alarm rate was above 15% (n = 21). RTs at target contrast equal to zero correspond to false-alarm trials. Target contrast bins are (0, 2–3, 4–6, 7–10, 11–15, 16–20, 21+). Solid line represents best linear fit of mean RT as a function of log contrast in target-present trials. Error bars are SEs across experiments.

