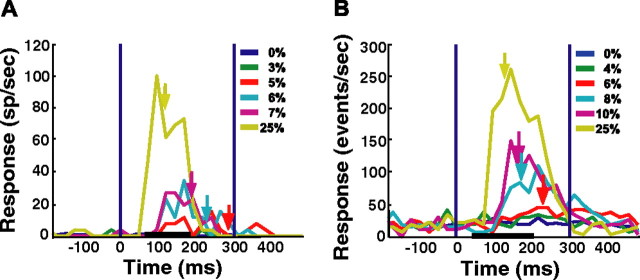
Figure 4.
Peristimulus time histograms from two representative recording sites. A, SU. B, MU. Neural responses were averaged over repetitions (n = 10 for each target contrast; n = 50 for target-absent trials). Bin size is 25 ms, and data points lie in the middle of the bin period. Vertical blue lines denote stimulus onset (time 0) and offset (time 300 ms). For conditions with at least four hits, colored arrows indicate the median RT. Horizontal black lines denote typical times of neural integration. The key shows target contrasts; 0% contrast = target-absent trials. SU and MU recordings are from different sites. sp, Spikes.

